|
|
|
|
Graphs
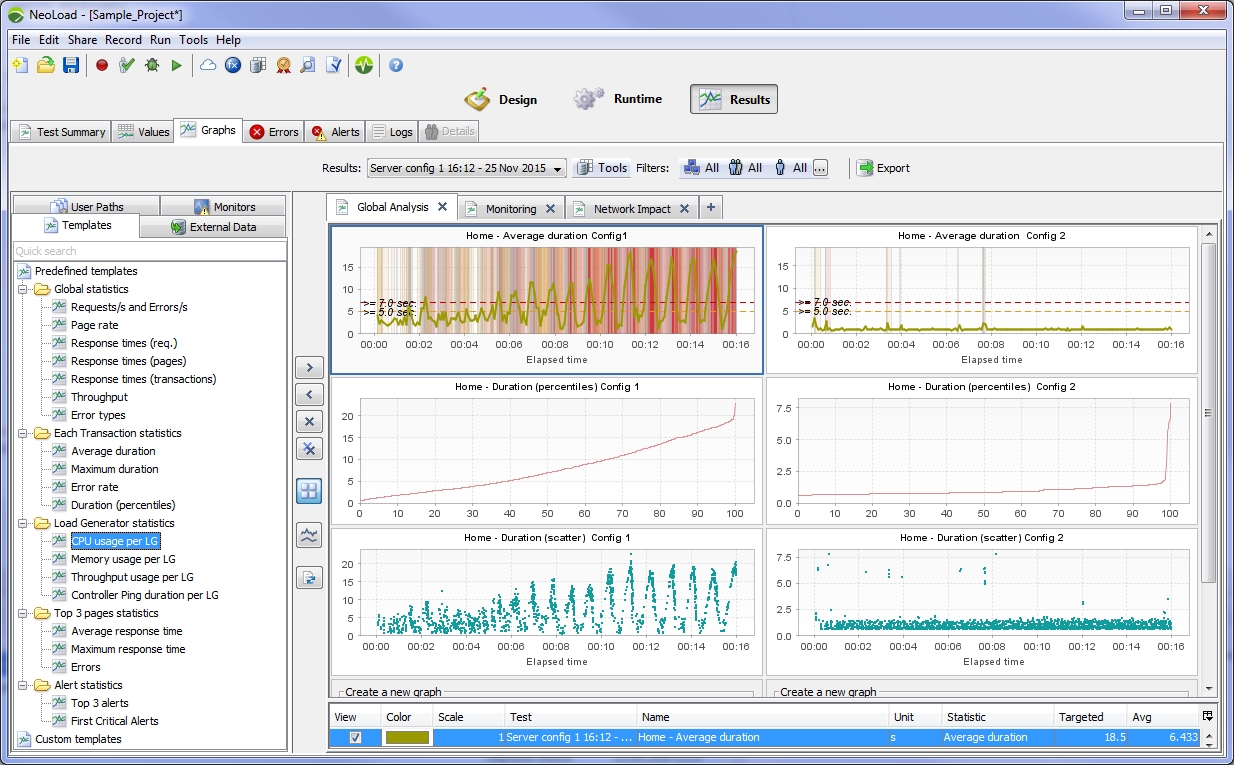
Graphs allow to visualize how statistics evolve over the test duration.
Each time a scenario is run, Neoload suggests copying the graphs generated in real-time toward this section by adding the graph Boards created during runtime. (For more information about runtime graphs, refer to Runtime graphs).
The graphs in the Results section are saved in the current project and are restored when the project is opened.
Graph templates, available under the Templates tab, give an immediate view of the application behavior during the load test. Custom graph templates can be defined too.

For more information about various topics affecting this subject, such as filtering by User Path described in Filter by Zone, Population or Virtual User, see General information about test results.