Work with graphs
On the active graph board, you can :
- Add a graph
- Duplicate a graph
- Remove a graph
- Update a graph with data coming from another test result
- Update all the graphs of the graph board with data from another test result
- Add in a graph, one or more curves coming from other test results
- Move a graph to another graph board
- Copy a graph to another graph board
Select a graph
You can select a graph with your mouse
- A single click selects the graph.
- A double click maximizes the graph.
You may also jump to adjacent graphs using the arrow keys.
Plot a graph
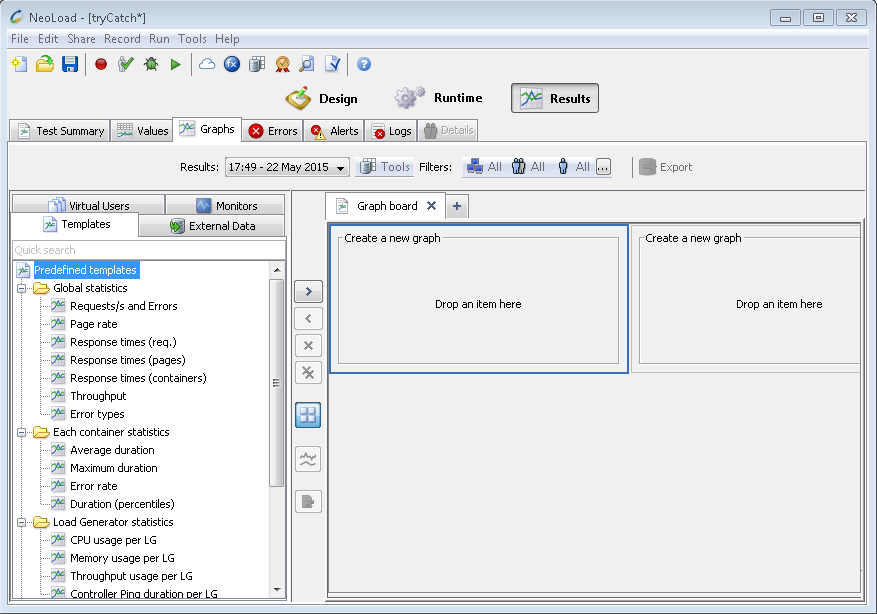
- To plot a graph
- Click the tab with the statistical data that you wish to plot.
- Select the item to be plotted in the tree.
- Select a Graph board.
- Select a location in a Create a new graph panel and click the > button or drag and drop the item or statistic onto the graph panel on the right.
- Enter a title for the graph. (For the graphs created based on a template, the graph name is automatically recovered from the template).
User Paths tab
Web pages, HTTP requests or Containers can be plotted in the graph.
If the selected node is a child of the Shared Containers node, the plotted statistics represent the aggregated statistics for all the User Paths that contain that element.
For more information about shared elements, see Shared Containers.
- Add a curve
- Click on the tab having the statistical data that you wish to plot.
- Select the item to be plotted in the tree.
- Select an existing graph.
- Use the > button or drag and drop the item or statistic onto the graph panel on the right.
Copy or move graphs
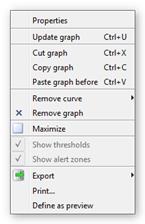
Select the graph, use the context-sensitive menu of the mouse, choose:
- Cut graph: to be able to move it (or CTRL + X on the keyboard).
- Copy graph: to be able to copy it (or CTRL + C on the keyboard).
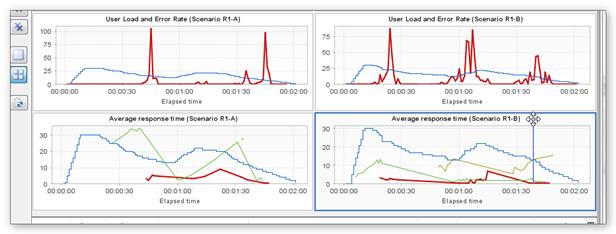
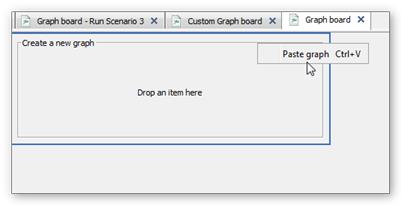
Change graph board and move to a blank graph space.
Paste (or Ctrl + V on the keyboard).
Update a graph
This method is used to substitute one or more existing curves, with curves coming from another test result.
- Case 1 : All the graph curves come from the same test result
- Select the data source with the Results drop down menu

- Select the graph in the graph board

- In the context-sensitive menu, choose the Update Graph
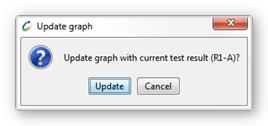
- Accept the update
The graph now displays the curves with data coming from the R1-A test result instead of R1-B.
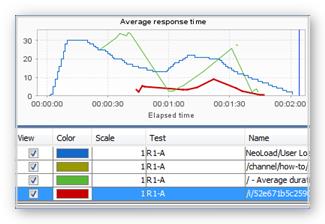
- Case 2 : The graph curves come from different test results
- Select the data source with the Results drop down menu

- Select the graph in the graph board
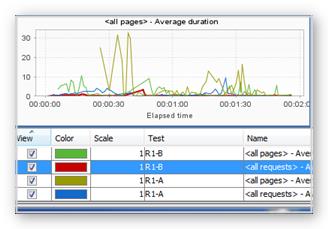
- In the context-sensitive menu, choose the Update Graph
- Choose the test results to substitute.

- Accept the update
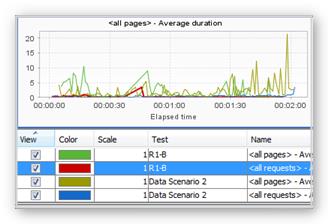
The graph now displays the curves with data coming from the "Data Scenario 2" test result instead of "R1-A".
Delete a graph
- To delete a graph
- Select the graph to be deleted.
- To delete the graph:
- Press the DEL key,
- Right-click and select Delete graph, or
- Click on the X button.
- Warning: When a graph is deleted, it is replaced by a blank graph space. This blank graph can be deleted if it is not the last remaining graph.
Delete a graph curve
- To delete a graph curve
- Select the graph to be modify.
- To delete the curve:
- Select the element in the caption bar and press the DEL key,
- Select the element in the caption bar, right-click and select Delete,
- Select the element in the caption bar and click the < button, or
- Right-click on the graph and select Delete a curve.
- Warning: Deleting the last remaining curve in a graph deletes the graph.
Move a graph
The layout of the graphs can be changed:
- To move a graph, it is necessary to drag and drop the graph to be moved to the new position (existing graph or Create a new graph position).
- To select the graph, it is necessary to either click on the edge of the graph, or press the SHIFT key and click in the center of the graph.
Maximize/minimize a graph
You may adjust the size of a graph to occupy all the available space, or minimize it.
To maximize or minimize a graph:
- Right-click, then select Maximize or Minimize.
- Click on the Maximize or Minimize button in the button toolbar.
- Double-click on the graph.