Logs
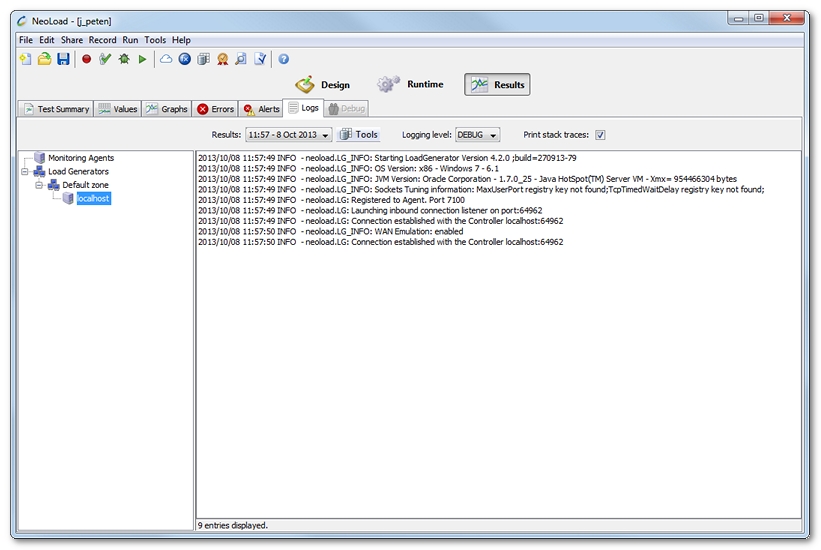
The Logs tabs allows you to view the log files of the various Load Generators and Monitoring Agents used during a test. The log can be viewed by selecting the Load Generator or Monitoring Agent in the tree.

- Tip: Right-click or use CTRL+F to search.
- The  flag against the Logs tab indicates that there is at least one log file containing at least one error.
- The  flag against the Logs tab indicates that there are no logs containing errors but at least one log file containing at least one warning.
- The  flag against a log file indicates that the log file contains at least one error.
- The  flag against a log file indicates that the file contains no errors but at least one warning.
The Logging level drop-down list allows filtering the log entries by level (FATAL, ERROR, WARN, INFO and DEBUG). For example, filtering on the ERROR level displays only the higher FATAL and ERROR level entries. The lowest level of filtering is DEBUG, which displays all entries.
The Print stack traces check box allows displaying or hiding the stack traces.
By default, only log files with a size less than 10 Mb are collected at the end of a test.
The size limit for Load Generators can be changed by editing the conf/agent.properties file in the Load Generator installation directory. See Logs of the Load Generators.
The size limit for Monitoring Agents can be changed by editing the conf/monitoringAgent.properties in the Monitoring Agent installation directory. See Logs of the Monitoring Agents.
At the display level, the file is shortened when its size is more than 20 Mb. In this case, only the first 20 Mb of the file is displayed. This size limitation cannot be changed.
- Tip: The Load Generators and Monitoring Agents log files can be found in the \logs sub-directory of the project test directory. See Project files.