Features specific to the Results section
Export Results graphs
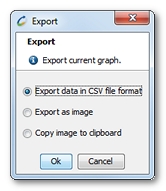
A click on the Export button makes it possible to export the selected graph data.

The Export wizard provides the following options:
- Export data in CSV file format
- Export as image to generate an image in PNG format
- Copy image to clipboard to copy an image to the clipboard (for pasting into any document: email, MS Word, etc.)
Not all test graphs may be exported at one time. To export test values in bulk, see Export results data.
Options
A number of options are available to modify the properties of a graph:
- Title
- Description
- Horizontal axis
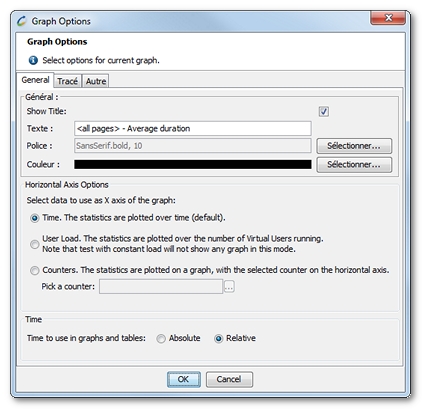
A right-click on a graph gives access to the contextual Properties command to display the Graph Options box.

In the General tab, the Horizontal Axis Options group box makes it possible to change the way graphs are plotted using different data for the horizontal axis:
- Time for time data (by default)
- User load data: The statistics are presented according to the number of Virtual Users running, the existing curves being converted using the new horizontal axis. This plotted curve provides an easy way to study a statistic behavior under different loads. This axis data is less useful if the load is constant or varies little.
- Monitor data: A Monitor may be selected among the Monitors run during the test.
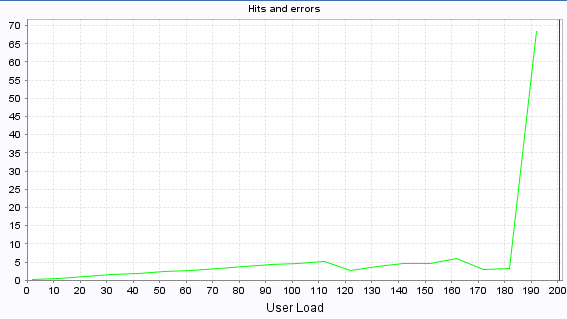
The following example is a curve showing the number of hits/sec. for a ramp-up load, using the number of Virtual Users as the horizontal axis data:

In the Time group box, the time scale of the x-axis for the graphs can be modified:
- Absolute is the option to display time in calendar dates.
- Relative displays time elapsed from a test start.
Delete all graphs
The Delete all existing graphs button in the Graphs tab toolbar removes all displayed graphs.
Compare test results
- To compare two test results
- Select the first test result, as described in Select a test result and plot the statistic for an element.
- Select the second test, and plot the same statistic on the same graph
The same method may be used to compare the results of several tests.
Modify the scale factor
The scale factor can be edited for each plotted curve in the caption bar of the selected graph.
- To modify the scale factor
- Select the curve to edit in the graph caption bar.
- Edit the scale factor.
- Validate the value by hitting the ENTER key.
Use graph templates
During the application testing process, it may prove necessary to plot the same graphs for the project in order to check performance progress as the various changes are made to the application and server settings. The Templates tab allows saving time in plotting default graphs for average page response times, test throughput, and so on. Custom graph templates can be created too.
The templates are saved to the project. When a test result cannot be traced on a graph template in its entirety, the graph shows all the statistics and monitors that can be plotted. A case in point is where the template includes a statistic for a page not played during the test.
- To create a custom graph template
- Create a graph the normal way (select the statistics or monitors, colors, etc.).
- Click the Templates tab.
- Select a custom template group, or create a new group by right-clicking on the Custom templates node.
- Add the current graph to the template by right-clicking on the group node or by dragging and dropping it.