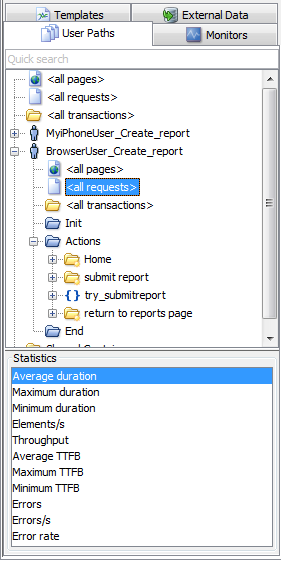
Statistics
Statistics graphs can be plotted in the User Paths tab.

Available statistics are:
- Average duration: Average response time
- Maximum duration: Maximum response time
- Minimum duration: Minimum response time
- Elements/s: Number of elements per second
- Throughput: Number of megabytes received from server
- Average TTFB: Average time to first byte
- Maximum TTFB: Maximum time to first byte
- Minimum TTFB: Minimum time to first byte
- Errors: Number of elements flagged as errors
- Errors/s: Number of elements flagged as errors per second
- Error rate: Number of elements flagged as errors out of the total number of executions
For Transactions only, 2 additional graphs are available:
- Duration (percentiles): allows to plot a percentile graph displaying the Transaction duration values recorded during a test.
This graph is used to determine the value of the i-th percentile of Transactions durations, where i goes from 0.1 to 0.99. This may reveal, for example, that 80% of the response times for web page P were under 5 seconds.
- Duration (scatter): allows to plot a scatter graph displaying the Transaction duration values recorded during a test.
This may reveal, for example, that the specific period when a given Transaction duration was above a given limit was mostly during the first hour of the test.
about scatter graphs:
They can only be drawn on an empty panel or over another scatter graph.
The number of points for the whole duration of the test is fixed at 3600 for x axis and 1800 for y axis. These values are configurable in the scatter.domain.resolution and scatter.range.resolution properties of the controller.properties file.
To learn more about this subject, for example how to filter by Virtual User described in Filter by Zone, Population or Virtual User, see General information about test results.