Runtime graphs
Statistics, monitors set on the servers and External data can be plotted on graphs during the test runtime. When the test is first run, NeoLoad creates default graphs. These can be modified during the test, or new graphs can be created. When subsequent tests are run, NeoLoad restores the settings of the graphs used in the previous test.
The legend panel displays the legend for the selected graph.

Depending on the monitor value sampling interval, there may be a delay before the curves are displayed on the graph (30 seconds using the default parameters).
Statistics
Available statistics are:
- Average duration: Average response time
- Maximum duration: Maximum response time
- Minimum duration: Minimum response time
- Elements/s: Number of elements per second
- Average TTFB: Average time to first byte
- Maximum TTFB: Maximum time to first byte
- Minimum TTFB: Minimum time to first byte
- Errors: Number of elements flagged as errors
- Errors/s: Number of elements flagged as errors per second
- Error rate: Number of elements flagged as errors out of the total number of executions
For Transactions only, 1 additional graph is available:
- Duration (scatter): Allows to plot a scatter graph displaying the Transaction duration values recorded during a test.
This may reveal, for example, that the specific period when a given Transaction duration is above a given limit is mostly during the first hour of the test.
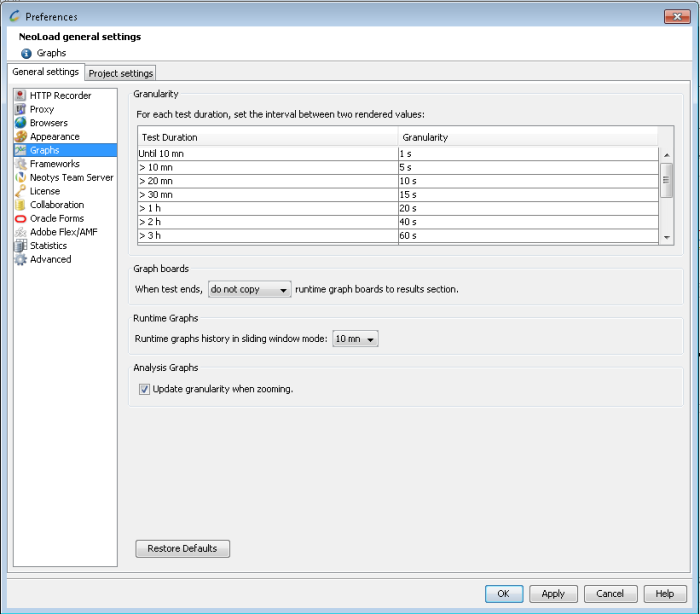
Once the scenario runtime is completed, Neoload suggests copying the graph Board(s) and their graphs to the Results section.

- To change the default behavior of the runtime graphs copy
- Go to Edit > Preferences.
- Select the Graphs section.
- Modify the settings in the Runtime Graphs: When test ends...
- prompt to copy (by default)
- copy all
- do not copy