Alerts
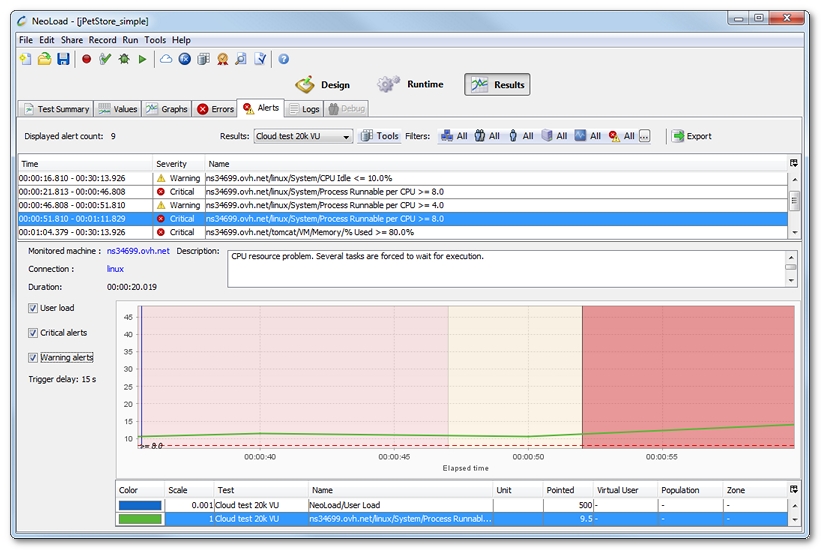
The Alerts tab displays details of the alerts that were triggered on performance counters during the test.

Each line in the table corresponds to a period of time during which the alert threshold was exceeded:
- Time: the alert start and end time, relative to the test start time.
- Severity: the alert severity level.
- Name: the alert name. It comprises the corresponding performance counter name plus a text description of the alert threshold.
General information
It is necessary to use the filter toolbar to filter the alerts by:
- zone
- population
- User Path
- monitored machine
- monitor
- alert severity level
The number of alerts displayed varies depending on the filters used. When the "Storage capacity exceeded" warning message is displayed, it indicates that the actual number of alerts recorded during the test exceeds the number of alerts displayed. By default, the maximum number of alert details stored is 50,000.
Increasing the maximum number of stored alerts will have an impact on NeoLoad performance.
- To change the alert detail storage capacity limit
- Stop NeoLoad.
- Open the <install-dir>/conf/Controller.properties file in a text editor.
- In the [Results]category, change the value of the max.alerts.store.count key. The default value is 50000.
- Re-start NeoLoad and repeat the load test.
Alert information
Selecting an alert displays the following information:
- Parent is the name of the parent of the element that triggered the alert.
- Element is the name of the element that triggered the alert.
- Duration is the alert duration.
- Description is the alert description.
- Delay trigger is the trigger delay for the threshold corresponding to the alert.
Alert graphs
When an alert is selected in the table, the graph displays all the alerts relating to the same element: a red zone for critical alerts and a yellow zone for warning alerts. The zone corresponding to the selected alert is shown in a slightly darker color.
The alert threshold values are represented by a horizontal dotted line.
- Tip: Clicking on an alert zone helps select the corresponding entry in the table.
Graph options
It is necessary to check the following boxes to display the corresponding elements:
- User load displays the user load.
- Critical Alerts displays the thresholds and zones indicating critical-level alerts.
- Warning Alerts displays the thresholds and zones indicating warning-level alerts.