Compare test results
Compare results in the GUI
NeoLoad graphical interface includes a Compare mode.
This makes it possible to compare the results of two tests. The more similar the designs of the Virtual Users are in both tests, the more relevant comparing the results is. It is advised to compare two test results with the same User Paths, but with different scenarios (different load policies, different durations, and so on).
An element of a User Path can be compared from a test to another when its name and its location are similar in both tests. When an element has been renamed or moved, comparing the statistics about the element from a test to another is unavailable.
Launch a comparison

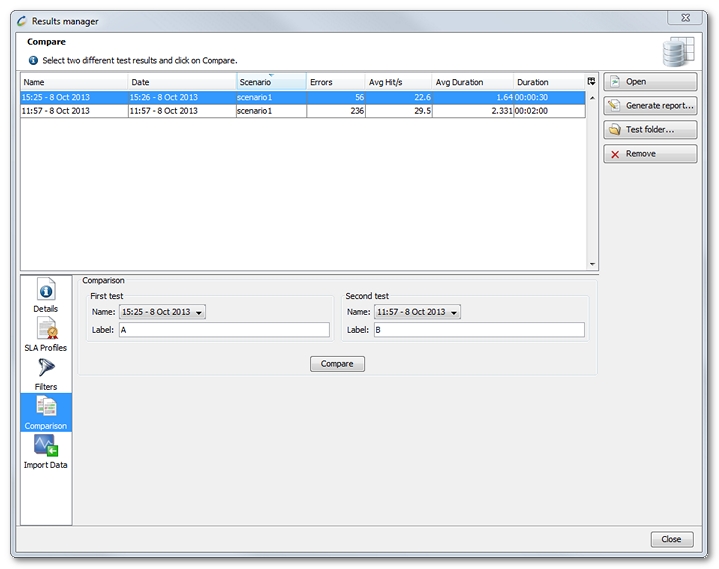
- To launch the comparison
- Open the Results Manager from the Edit > Results Manager menu.
- In the table, select the two results to compare.
- Click on the Compare button.
- Edit the labels of the two tests and click OK. The default labels are "A" and "B".
Use the GUI
The Summary, Values and Graphs tabs switch to the Compare mode. The Errors and Details tabs are superfluous and are therefore disabled.
In the Compare mode, only the statistics for Avg, Max and Err are displayed, together with the value in the first test, value in the second test, and percentage difference for each item.
- Tip: It may be useful to display additional stats in the Values panel using the column selector in the upper right-hand corner of the table.
Percentages color coding
The percentages are displayed in different colors depending on whether the statistic performance has improved or deteriorated:
- Green: percentages showing an improvement in performance.
- Red: percentages showing a deterioration in performance.
- No color code is applied to percentages which are not connected to performance.
Consequently, a positive percentage (+20%) will be color-coded differently, depending on the context: for example, red in the case of a time delay or green in the case of Hits/sec.
Return to Standard mode
To quit the Compare mode, it is only necessary to call up a single test result:
- in the test result drop-down list, or
- in the Results Manager.
Generate a comparison report
NeoLoad can generate comparison reports with the same structure and in the same formats (Word, HTML, PDF, and XML) as standard reports.
In the Compare mode, only the statistics for Avg, Max and Err are displayed, together with the value in the first test, value in the second test, and percentage difference for each item.
- To generate a comparison report
- Open the Results Manager from the Edit > Results Manager menu.
- In the table, select the two results to compare.
- Click on the Generate a report button.
- Edit the labels of the two tests and click OK. The default labels are "A" and "B".