Details
The Details tab is enabled when the scenario has been launched in Debug mode or when the project contains external data.
For more information about starting a test in debug mode, see Start the test. For more information about changing the data logging level, see Overview.
per User Paths
- Select the User Paths drop-down menu.
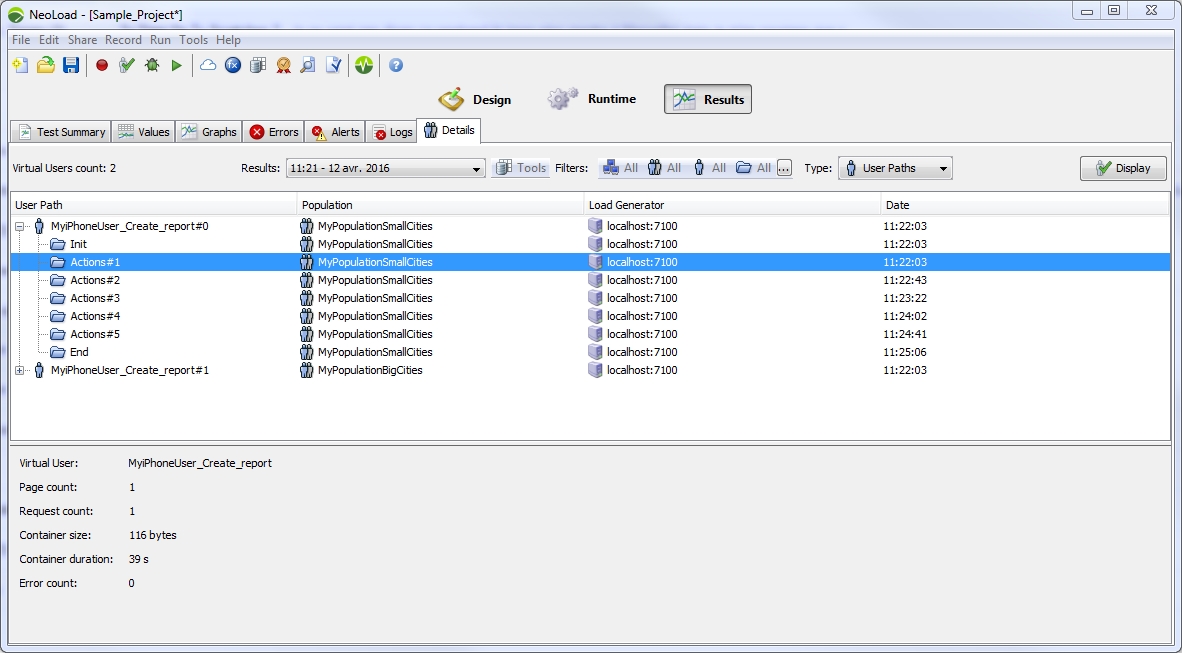
This tab displays the User Paths iterations executed during the test:
- The first level in the tree represents the Virtual Users: the label shows the User Path name followed by its instance number (for example Visitor#2 for instance number 2 of the user Visitor).
- The second level in the tree represents the iterations of these Virtual Users: the label shows either the Container name (for example, the Init Container or the End Container) or the iteration of the Actions Container, (for example, Actions#3 for the third iteration in the Virtual User).
- Warning: This tab is empty if the test has not been launched in Detail mode.
Only the iterations of Virtual Users matching the Detail mode criteria are made available:
- By default, only the iterations of Virtual Users containing errors are displayed. However, the trace of the Init and End Container runtimes is always made available for Virtual Users that contain errors.
- In the opposite case, all Virtual User iterations are made available.
Virtual User iteration runtime overview
Selecting a Virtual User iteration execution (second-level node in the tree) displays the following information:
- Virtual user is the name of the Virtual User that executed the iteration.
- Total pages is the total number of pages that instance of the Virtual User executed for the Container.
- Total requests is the total number of requests that instance of the Virtual User executed for the Container.
- Container size is the total size in bytes of all the pages executed in the Container.
- Container execution time is the total time taken to execute the entire Container.
- Total errors is the total number of requests returning errors during the Container execution.
Validate a user runtime
When the scenario is started in Debug mode, it may be useful to view the details of a User Path iteration at the end of the test. To do this, the desired Container (second-level node in the tree) must be selected, then the Show Virtual User button must be clicked.
The Virtual User iteration is displayed in the validation window. For more information about the validation window, see Check a Virtual User.
Binary responses are not recorded in Debug mode for performance reasons.
per external data
Select from the drop down menu : External Data.
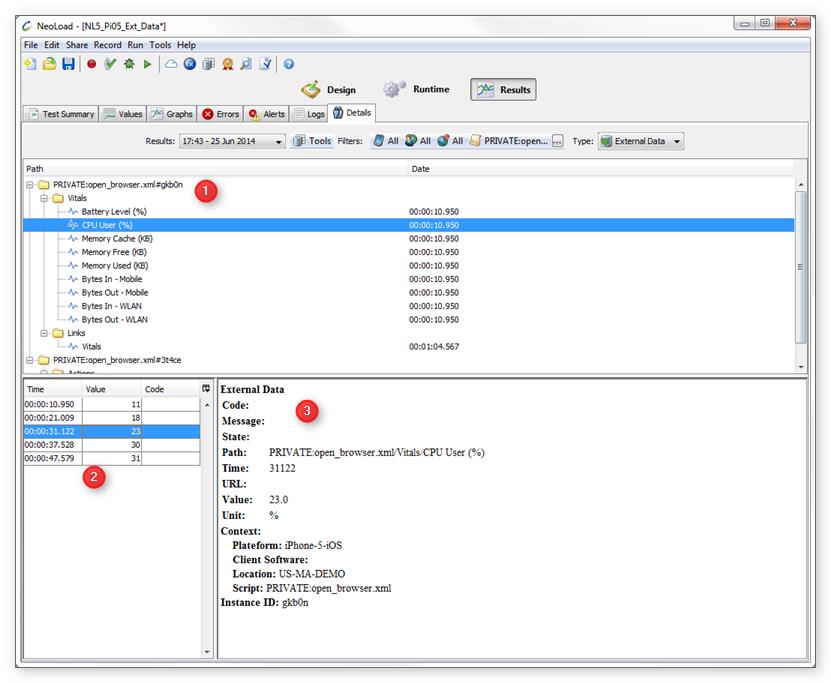
No matter which test mode (normal or debug) was used, the external data injected during execution can be displayed on this panel. Data are aggregated per path and execution instance.
- In area (1):
- Path column: the script Name followed by the instance ID which identifies one execution of the script, followed by the types of available measured values.
- Date column: the timestamp of the first data received relative to the start of the test.
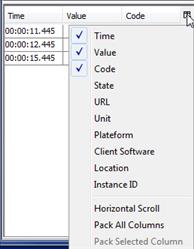
- In area (2) :
- List of values received sorted by time.
- Click to the right of the Code column to select which columns will be displayed (by default Date, Value and Code).
- In area (3) : Request details.