Create a schedule
- Create a new schedule
-
Project (right-click) | New | Performance Schedule
Type the name of the schedule, and then click Finish.
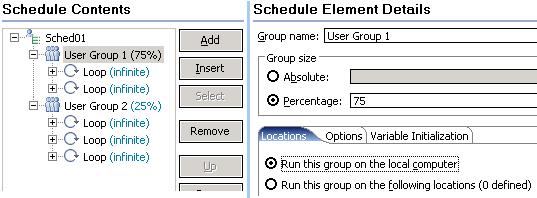
- Add user groups...
-
Schedule (right-click) | Add | User Group
- Set user group locations
-
User Group | Locations | Run this group on the following locations
- Add loops
-
User Group (right-click) | Add | Loop
- Add selectors and their weights:
-
Schedule element (right-click) | Add | Random Selector
- Add tests to each user group...
-
Schedule element (right-click) | Add | Test
- Set the stages for the schedule
Each stage lasts for a specific amount of time and contains a specific number of users. By setting stages, you can model workloads that reflect real-world usage over time. Putting the tests in a stage in an infinite loop prevents virtual users from finishing before the stage ends.
To set a stage:
- Open the schedule, and click...
-
User Load tab | Add
Enter the number of users in the stage and the duration of the stage.
- To automatically generate a report that compares each stage...
-
Window | Preferences | Test | Performance Test Reports | Launch Compare report when staged run completes
- Add other schedule elements to refine the schedule structure:
Right-click a schedule element, and click Insert (adds the new element before the selection) or Add (adds the new element after the selection).
Element Purpose Synchronization point Coordinate the activities in a schedule, such as forcing virtual users to wait at a specific point Delay Emulate user actions accurately; for example, a user might delay before placing an order Comment Notes and comments regarding the schedule element - Set the schedule options:
Tab name Typical setting Resource monitoring Capture resource monitoring data from these sources: - Apache HTTP Server Managed Beans
- Apache Tomcat Managed Beans
- IBM DB2 monitoring
- IBM Tivoli monitoring
- IBM WebSphere PMI
- JBoss Application Server Managed Beans
- JVM Managed Beans
- Oracle Database monitoring
- Oracle WebLogic Server Managed Beans
- SAP NetWeaver Managed Beans
- rstatd daemon (UNIX)
- SNMP agents
- Windows Performance Monitor
Response time breakdown Collect response time breakdown data from HTTP or SOA tests. Think time Increase, decrease, or randomize the think time. The default setting is to use the recorded think time. Statistics log level Typically, keep the default settings. If you are running a long test, change the sampling rate from the default 5 seconds to a larger interval. Test log level Typically, keep the default setting of Primary test actions. You must have at least this level of logging to create a Page Percentile report and to see page title verification points that you have set. Problem definition log level Set the default settings only when requested to do so by IBM Software Support. Advanced At the bottom of the Schedule Element Details area click "Edit Options" to set protocol-specific options that apply to all tests in the schedule. Setting protocol-specific options for a schedule is similar to setting protocol-specific options for a user group.
What to do next
Run the schedule against successive builds of the application under test or with an increasing number of virtual users.
Related:
Schedule overview
User group overview
Working with agents Set user loads
Run long duration tests
Add a test to a schedule
Assign variables to schedule and user group
Define performance requirements in schedules
Repeat tests in a schedule
Delay virtual users or actions
Run tests at a set rate
Run tests in random order
Add a transaction to a schedule
Synchronize users
Emulate network traffic from multiple hosts
Set log and statistic levels
Enable resource monitoring on Windows Vista, Windows 7, and Windows Server 2008
Enable response time breakdown for Windows Vista, Windows 7, and Windows Server 2008Error 404 - Not Found Error 404 - Not Found
The document you are looking for may have been removed or re-named. Please contact the web site owner for further assistance.
- Open the schedule, and click...