Set the data that the test log collects
Overview
The test log shows the events that occurred during a run. By setting the level of information collected for a schedule run, you can control whether you receive individual response-time statistics for Page Percentile reports and information about verification points. You can set the level of detail for each type of event: errors, warnings, and other events.
The level of information collection directly affects log sizes. Depending on the setting that you select, the logs can become quite large. By limiting the log level and collecting the information from a representative sample of users, you can decrease the log size and still have sufficient information for analysis.
For example, if you are debugging a test, you might set all three What to Log fields to All or Action Details. These settings produce large test logs, especially if the tests are long or you are running a large number of users. Large test logs, in turn, increase the test log transfer time, and might even cause the computer to run out of disk space.
To reduce transfer times and the likelihood of running out of disk space, sample information from a very small subset of users; smaller even than the default of 5 users per user group.
- A fixed sampling rate samples the same number of virtual users from each group.
- A percentage sampling rate samples a percentage of virtual users from each group, but guarantees that at least one user is sampled from a group.
Set the amount of information collected in the test log and the rate of sampling
- In the Test Navigator, browse to...
'
-
Schedule | Schedule Contents | Schedule | Test Log
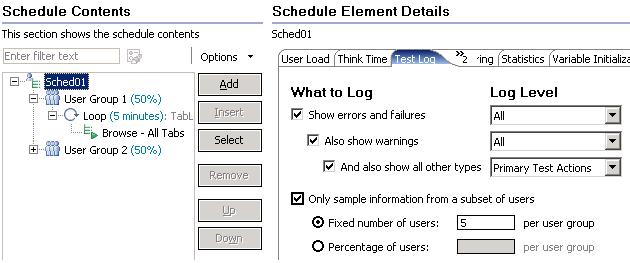
- Select the types of events to collect under What to Log...
- Show errors and failures
- Also show warnings
- And also show all other types
If none of the What to Log check boxes are selected, no test log events are collected.
- For each type of event, set the Log Level to one of the following options:
- The overall schedule verdict. The verdict can be one of these values:
- A primary request was not successfully sent to the server. No response was received from the server.
- A primary request response was incomplete or could not be parsed.
Pass All verification points matched or received the expected response. For example, a response code verification point is set to PASS when the recorded response code is received during playback. If the test does not contain verification points, PASS means that all primary requests in the test were successful. Fail At least one verification point did not match the expected response or the expected response was not received. Error Either... - The start and stop time of the schedule, each user group, each virtual user, and each test invocation.
- The start and stop time of each loop iteration, if loops are set in the schedule.
- The start and stop time of each selector, if selectors are set.
- Test verdict, test start, and test stop events.
- Loop iteration start and loop iteration stop events, if loops are present in the test.
- Transaction start and stop events, if transactions are present in the test.
- For HTTP tests, page title verification points.
- The page verdict.
You see a page verdict only if a connection problem occurs or if you have set verification points. Any failures or errors are rolled up to the test verdict level.
- The start and stop time of each page.
- The start and stop time of each loop, and the number of iterations of each loop, if you have set loops within a page.
- The start and stop time of each transaction, and the duration of each transaction, if you have set page-level transactions in the test.
- The page verdict.
- For SAP tests, SAP screen information, such as SAP screen title verification points.
- For Citrix tests, connection elements, window events, and image synchronizations
- For socket tests, connect, send, receive, and close elements.
- For HTTP tests, request-level events.
To collect information about response code or response size verification points that you have set, set data collection at this level of detail or greater.
- The time that the first byte and last byte were sent.
- The time that the first byte and last byte were received.
- The character set of the response data.
- Expected and actual values of page-level verification points that you have defined.
- HTTP think events.
- The start and stop time of each transaction, and the duration of each transaction, if you have set request-level transactions in the test.
- For SAP tests, SAP element information (primarily Set Property or Call Method actions).
- For Citrix tests, synchronization points, delays, text elements, and logoff elements.
- For socket tests, this option does not apply.
- For HTTP tests, request and response data; for example, HTTP headers and any request data.
- For SAP tests, think time information.
- For Citrix tests, think time information, mouse actions, and keyboard actions.
- For socket tests, this option does not apply.
Description Schedule Actions Collects events that correspond to actions executed in the schedule: Primary Test Actions Default. Includes schedule actions, plus... Secondary Test Actions Includes primary test actions, plus... Action Details Includes secondary test actions, plus... All For HTTP, SAP, and Citrix tests, All and Action Details provide the same information. For socket send and receive actions, the exchanged data is also available in the test log, by means of attachments.
- The overall schedule verdict. The verdict can be one of these values:
- To set a sampling rate, select...
-
Only sample information from a subset of users
The number or the percentage that you select is applied to each user group. If you are running user groups at remote locations (, on agent computers), the number or percentage that you select is distributed evenly among each location.
- If sampling rate is 10%, one user is sampled from the first group, and 100 users are sampled from the second group.
- If sampling rate is 25%, one user is sampled from the first group, and 250 users are sampled from the second group.
Description Fixed number of users The number is applied to each user group. Assume that the schedule contains two user groups. One group contains four users, and one group contains 1000 users. If we specify 2 for this option, two users are sampled from each group. Percentage of users The percentage is applied to each user group—but at least one user will be sampled from each group. Assume that the schedule contains two user groups. One group contains four users, and one group contains 1000 users.
Example
The default setting, to log all errors and warnings, as well as primary test actions, fits most purposes. However, you can log any type of information, from no information to all information from all users, although neither is a typical situation.
- To see only errors and warnings, set the first two What to Log check boxes to All and clear the third check box...
-
And also show all other types
...to avoid logging successful events.
- To check a schedule's structure, when you are not interested in the test execution results, set all three What to Log check boxes to...
-
Schedule Actions
Both choices, as well as the default setting, will limit the size of the test log and reduce the total time to run the schedule by significantly shortening the test log transfer time at the end of a test.
If you are debugging a test, you might set all three What to Log fields to All or Action Details. These settings produce large test logs, especially if the tests are long or you are running a large number of users. Large test logs, in turn, increase the test log transfer time, and might even cause the computer to run out of disk space.
Set the statistics displayed during a run
Set the problem determination level
Error 404 - Not Found
The document you are looking for may have been removed or re-named. Please contact the web site owner for further assistance.