Analyze the result of a test
Analyzing the result of a test consists in investigating how the application has performed during the test with summaries, graphs, and detailed reports. NeoLoad offers a variety of facilities to filter, compare, and measure the results against the expected service level (SLA). This helps evaluate how robust the application is and what weakness issues should be solved.
The result of the performed tests can be viewed in the Results section of the NeoLoad Controller. Reading the result of a selected test is organized in the following reports represented by the Results section tabs:
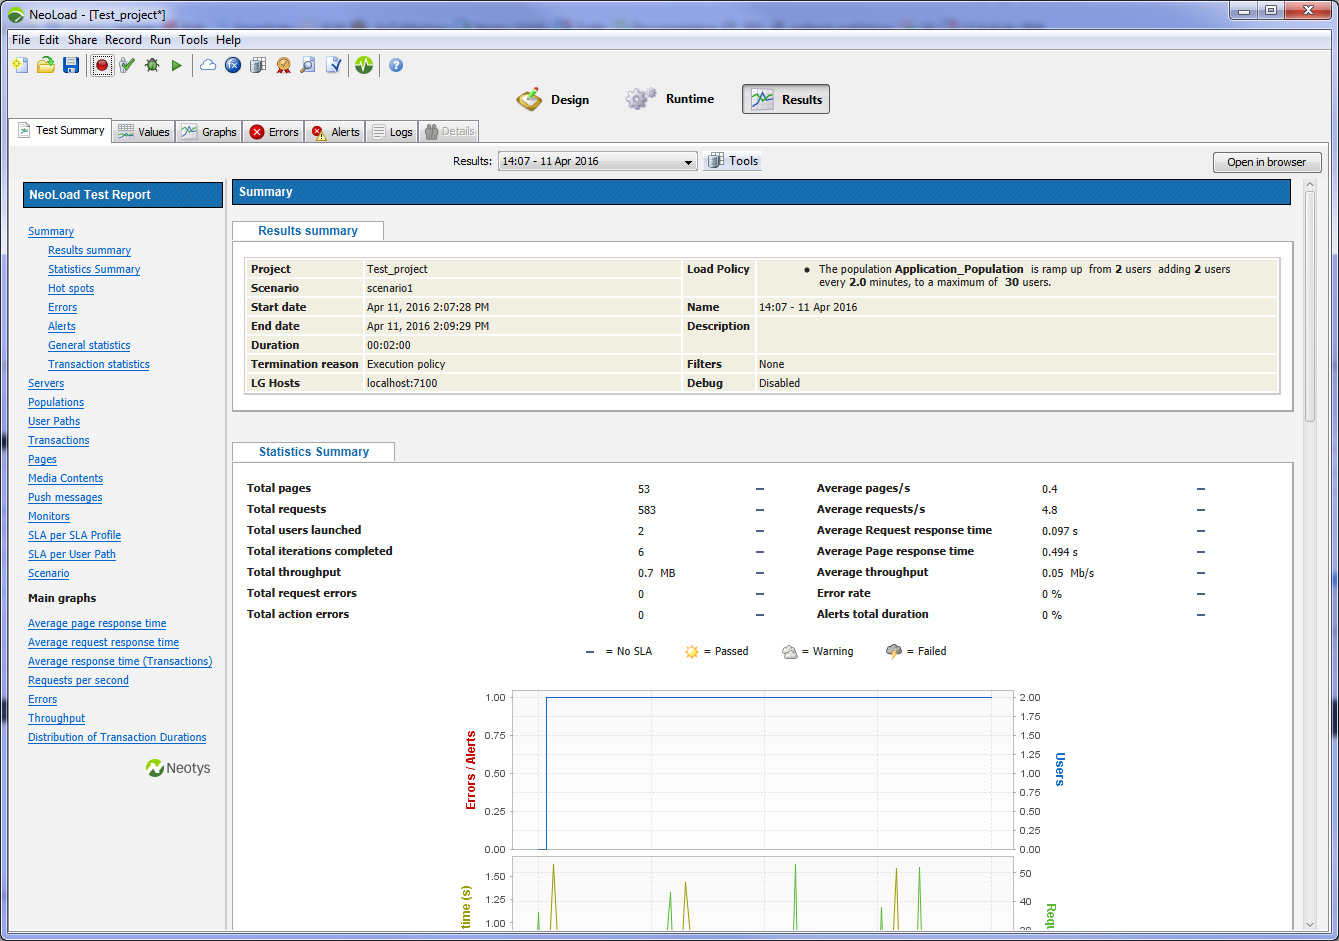
- Comprehensive test report generated by NeoLoad in the Test Summary tab:

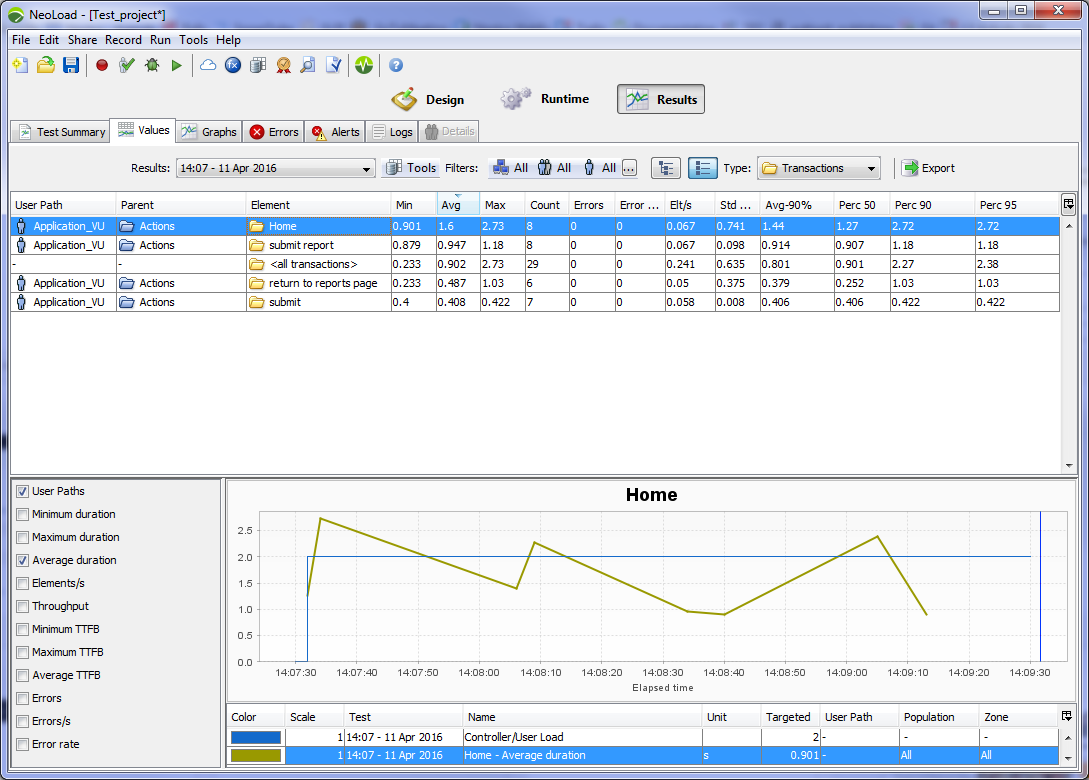
- Advanced statistics and graphs about every tested application component in the Values tab:

- Variety of graphs about any tested component in the Graphs tab
- Description of every request error in the Errors tab
- Description of the alerts about the server performance and about SLA nonconformities in the Alerts tab
- Log entries about the Load Generators and the Monitoring Agents used in the test in the Logs tab
- List of the invalid Virtual Users identified during the test (in debug mode) in the Details tab
For more information about reviewing a test result, see General information about test results.

Analyze the result of a test
- In the NeoLoad Controller, open your project. Click Results.
- In the Results list box displayed in the toolbar of every tab, select a test previously performed. To publish a report in PDF, Word, HTML, or XML, choose Tools > Generate report.
- In the Test Summary tab, click in the test report table of contents to display the description of the tested components.
- In the Values tab, select an application component to view its behavior during the test.
- In the Graphs tab, select the graphs that you specifically need with drag-and-drops.
- In the Errors tab, select a running error to display information about it.
- In the Alerts tab, select a server or SLA alert to display a graph about it.
- In the Logs tab, select a Monitoring Agent or a Load Generator to view its log.
- In the Details tab, for a test in debug mode, you can either:
- select Virtual Users as the type, choose a User Path, and double-click a container to display information about its behavior during the test.
- select External Data as the type, and choose a specific item to display the external data injected during execution.
- In the Values, Errors, and Alerts tab, you can select application and test components to display their definition in the Design section.
See
- Use results
- Results
- Test summary
- Graphs
- Values
- Errors
- Analyze errors in the Errors panel
- Alerts
- Logs
- Details
- Publish a test report
- Compare test results
- Compare several test results
- Filter test results