Import response time breakdown data
Content
- Overview
- IBM Tivoli Monitoring for Transaction Performance
- Import application data from a production environment
- Import data
- Results
- ITCAM for WebSphere import
- Related
Overview
To import response time breakdown data, one of the IBM Tivoli Monitoring products must be installed on the application server that will collect the application data.
IBM Tivoli Monitoring for Transaction Performance
To set data available to be imported from IBM Tivoli Monitoring (ITM) for Transaction Performance, configure...
- data collection mode
- recording settings
ITM for Transaction Performance has two modes of data collection:
- Aggregated
High-level statistics about classes and methods, such as average execution time. Aggregated statistics might not reveal intermittent performance problems.
- Instance
Data on a per-instance basis in addition to aggregated statistics. You see exactly what calls were made, by which process, what time
The data stored in the ITM for Transaction Performance database depends on how ITM for Transaction Performance is configured prior to data collection.
ITM for Transaction Performance can also be configured to...
- record instance-level data all the time
- start collecting only when a threshold has been violated
In ITM for Transaction Performance, trace levels are configurable...
- off
- low
- medium
- high
- custom
...and the configuration setting affects how much data is collected by the IBM Tivoli Monitoring server and stored in the database.
The performance analysis tools will import all of the data collected with respect to this trace configuration setting. If the ITM for Transaction Performance policy settings for Java EE servlets are too low, you might collect less data than you need and expect.
Beware firewalls and proxy servers.
Import application data from a production environment
When an application performance problem occurs in a production environment, you can import response time breakdown data from...
- ITM for Transaction Performance
- ITCAM for WebSphere
- ITCAM for Response Time Tracking
...and analyze it to identify where the problem is occurring.
You can also import response time breakdown data in the Test perspective.
Import data
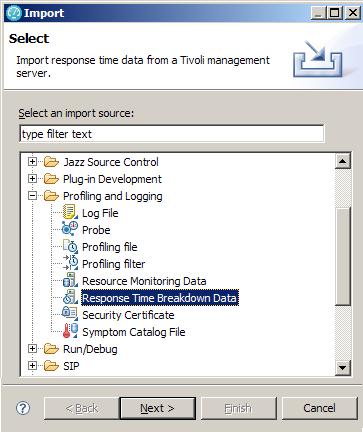
- Click...
-
File | Import | Profiling and Logging | Response Time Breakdown Data | Next
- Specify the host of the IBM Tivoli Monitoring server.

If required, set User and Password fields.
- If the server is configured to use SSL, select the check box...
-
Requires SSL security
- To use default ports, 9081 (insecure) and 9446 (SSL), select...
-
Use default port for the Web Service Port
Otherwise, select option Use port option and specify your port.
- Click Next.
- Specify the time period for which to import data.
You might need to adjust the time interval to compensate for clock discrepancies between the workbench and the monitoring server.
When specifying the time in a specific number of units, note that for consistency, "month" is defined as 30 days and "year" is defined as 365 days. "Days" refers to 24-hour periods, not calendar days. The units of time selected are subtracted from the time that you click Finish to import the data to give the start time.
For example, if you select 2 months, the time period will be the 60 days (24-hour time periods) immediately prior to the time you click Finish.
- Specify the type of data to import.
For detailed analysis, you typically want to choose...
-
Import detailed instance-level data
...although it might involve a large quantity of data.
If you select...
-
Import aggregated statistics
...the data imported will be statistical summaries, not the kind of data that can be analyzed in sequence diagrams or trace tools.
ITM for Transaction Performance must be configured to record instance-level data to import instance-level data. If configured to collect only aggregated data, regardless of what you select here, only aggregated statistical data will be available in the ITM for Transaction Performance database.
ITCAM for WebSphere does not collect aggregated statistics. If you specify...
-
Import aggregated statistics
...with ITCAM for WebSphere, the import will fail.
- Click Next to continue.
- Select the Policies or Traps from which to import data.
Typically, you will import from policies or traps that have severe problem statuses (such as critical or failure), because they will point you to the code problems. Selecting only the most serious policies or traps helps limit the quantity of data imported. Click the Status column heading to sort the policies according to severity. Click Next. Policies are used by ITMTP and ITCAM for Response Time Tracking. Traps are used by ITCAM for WebSphere.
- The policies, or traps, selected are associated with a group of hosts (computers) in the application system. Select the hosts you wish to examine (usually the hosts with the more critical status).
Specifying a subset of hosts will again reduce the quantity of data imported, helping you focus on where the problems really are. Click Next. When importing data from ITCAM for WebSphere, the WebSphere Application Server node name is listed, rather than the actual host name. This is set by the server administrator and does not necessarily have to be related to the actual host name, though that is the default choice.
- If you chose to import instance-level data, you can select the transactions for which you are interested in seeing data.
The Time column indicates when the transaction started, and the Duration column indicates how long the transaction took. You can sort the data by clicking on any of the column headings. Click Next. The transaction pattern listed is not the actual URL of the transaction, but rather a regular expression pattern match for the URL that it matched in ITMTP.
- Provide the workspace location for storing the imported data by specifying the Profiling project and Monitor names.
You must change the default names for the profiling project and monitor. Specify test project as the profiling project and the performance report under which to store the data as the monitor; if you do not, the data will not import correctly.
- Click Finish to import the data.
Results
When importing, you might receive the following error message:
- IWAY0161E Unable to connect to the ITMTP management server. Please verify correct host name was entered, the server is running, and there are no firewalls blocking the specified port.
Also, the log (in /.metadata/.log) would show the following exception:
- java.net.SocketException: Operation timed out: connect:could be due to invalid address
The problem might be caused by the workbench or the ITMTP management server being behind a firewall.
Check that you have set the host name and port correctly in the Import wizard. If these values are correct, then you should contact a system administrator to see whether the firewall problem can be resolved.
The port that you need to be able to connect to on the host running the ITMTP management server was configured at the time the management server was installed. By default, the ports are 9081 for regular communication, and 9446 SSL enabled communication. (These are the ports used when you select the Use default port option.)
After you have collected the response time breakdown data, you can begin analyzing it and diagnosing the problem. You can view the data using several views including statistics views and sequence diagrams of class and object interactions, to help find the cause of the performance problem.
You can configure the ITCAM for Response Time Tracking listening policy to collect hourly averages by unique transaction, or by monitor. You must set the listening policy to "Hourly Average by Unique Transaction" to see full transaction names.
ITCAM for WebSphere import
When importing response time breakdown data from ITCAM for WebSphere, there are two authentication layers involved.
| WebSphere authentication | Will reject an invalid user/password on the system and display an authentication dialog. |
| ITCAM for WebSphere authentication | Will return no data available to import if authentication fails. |
The only case where WebSphere authentication will pass and ITCAM for WebSphere authentication will fail is when the user types a valid user name on the underlying operating system (for example, root), but that user is not registered in ITCAM for WebSphere. In this case, the user must be aware that the server will not display an error when authentication fails, but the user will instead see no traps available from which to import.
When importing data from an ITCAM for WebSphere trap, ensure that the clocks of the monitoring server and the workbench are synchronized.
In the import wizard, the option to import the last n units of time uses the current time on the local computer, but queries for traps which have activity in that time period on the monitoring server clock. So if the monitoring server clock is ahead by 10 minutes, you will have to either wait 10 minutes before the import wizard will find this transaction available on the server, or query 10 minutes into the future.
Methods are timed in ITCAM for WebSphere using millisecond granularity. Because of this, when importing from the ITCAM for WebSphere monitoring server, the resulting data may show response times of 0 for certain methods with extremely fast execution.
Class names that are stored in method traces by ITCAM for WebSphere may be truncated when you import data from the ITCAM for WebSphere monitoring server. To avoid truncation, edit...
-
MS_HOME/etc/aa.properties
MS_HOME/etc/aa1.properties
MS_HOME/etc/aa2.properties
...and set...
- TEXTSTRING_LENGTH=255
...where MS_HOME is the installation home directory of the ITCAM for WebSphere monitoring server.
Related
- Problem analysis overview
- Data collection infrastructure
- Common application performance problems
- Analyze distributed application performance problems
- Collect real-time response time breakdown data