Collect real-time response time breakdown data
Overview
To collect real-time response time breakdown data...
- The data collection infrastructure must be running on all computers from which data is to be collected.
- The Agent Controller port, part of the DCI, must be set to the default (10002).
- Networks should not use internal IP addresses or network address translation.
- The network should not using firewalls or proxy servers.
To collect real-time response time breakdown data (profile) from an application system, establish a connection to the DCI.
Identify the first application server that the transaction request reaches. When profiling applications under a test, the initial transaction is started in the host that is running the test. This server is essentially the gateway into the application.
You do not need to explicitly create a connection to each computer involved in the distributed application to monitor. Through a process called dynamic discovery, the workbench will automatically connect to each computer as the transaction flows to it.
When you know the first application server, do the following steps:
- In the workbench, open the Profiling and Logging perspective.
-
Window | Open Perspective | Other | Profiling and Logging
If prompted to enable related capabilities, click Yes.
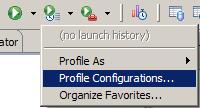
- Click the drop-down arrow on the Profile button
 on the toolbar, and select Profile Configurations.
- In the Launch Configuration dialog, select the J2EE Application type, right-click, and select the New button.
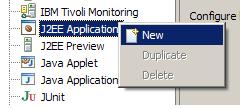
Note that if application is not running on a Java EE application server, but rather is ARM instrumented manually, select the ARM Instrumented Application configuration type, instead.
- On the Host page, select the host identified above.

If the host you need is not on the list, click Add and provide the host name and port number. Test the connection before proceeding.
- On the Monitor page, select the type...
-
J2EE Performance Analysis analysis

If profiling an ARM instrumented application, choose type...
-
ARM Performance Analysis analysis
To customize the profiling settings and filters. Click the Edit Options button.

- Click Profile.
The connected agent and its host and process will be shown on the Profiling Monitor view. Depending on profiling configuration, more than one agent may be shown.
- Before you start monitoring, bring the application to the state right before the problem trigger.
For example, if an action on a particular Web page is slow, navigate to that page.
- Start the monitoring agent by selecting the agent and clicking the Start Monitoring button on the toolbar.
If there is more than one agent for this profile configuration, start monitoring each of the agents. Any activity in the application that fits the profiling settings that you specified earlier will now be recorded. The agent state will change from <attached> to <monitoring>, and <monitoring...collecting> whenever data is being received from the agent.
- In the application, perform the steps required to trigger the problem.
- Stop monitoring the agent by selecting Stop Monitoring from its pop-up menu.
For best results, detach from the agent so that other users can profile the system. Right-click the agent and click Detach in its pop-up menu.
Repeat this step for each agent involved in collecting the data.
Results
Now that you have collected the response time breakdown data, you can begin diagnosing the problem. You can view the data using several views, including statistics views and sequence diagrams of class and object interactions.
Related
- Problem analysis overview
- Data collection infrastructure
- Common application performance problems
- Collect and analyze response time breakdown data
- Customize real-time profiling settings
- Importing response time breakdown data