Values
In the Results section, the Values tab allows sorting and plotting elements of a test quickly.
By default, the tab shows the table of the elements types sorted in decreasing average time and the graph corresponding to the selected element. A click on the See values in tree mode button makes it possible to switch to the view by element organization, described in View by element organization.
- Tip: For more information about various topics affecting the selection of a test result, see General information about test results.
View by element type
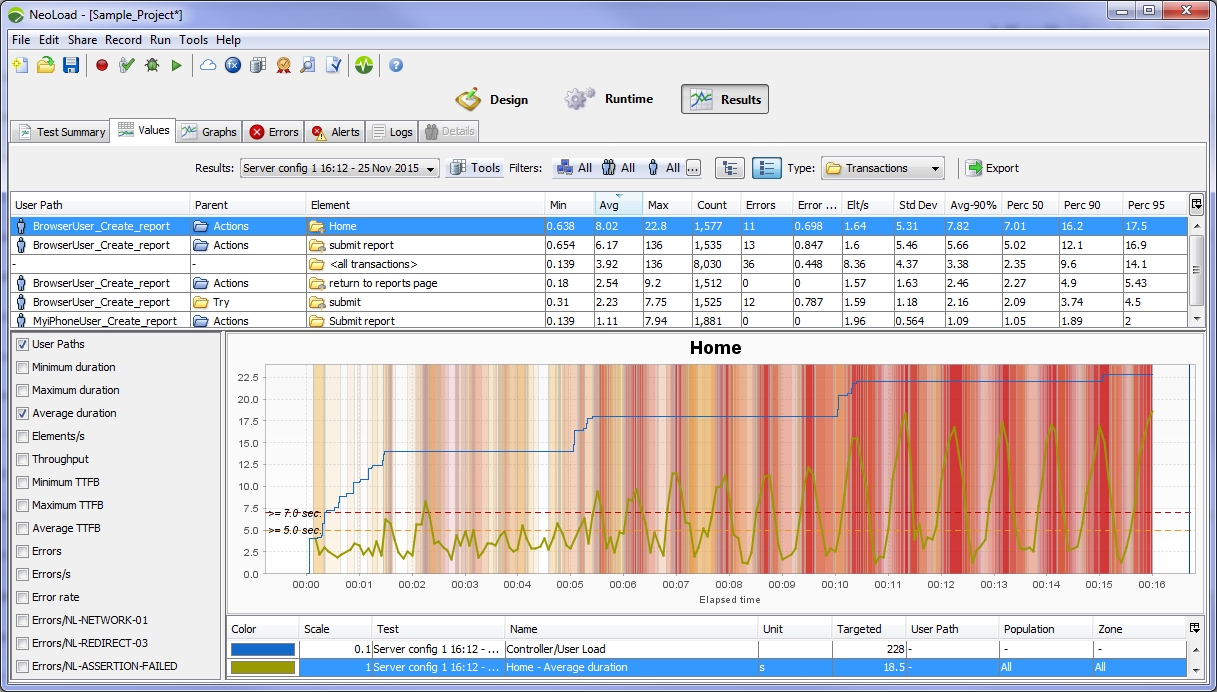
In the Values tab, a click on the See values in list mode button gives a global overview on a element type. The tab displays:
- the table of the element types in the test scenario and their performance
- the graph showing the performance of a selected element
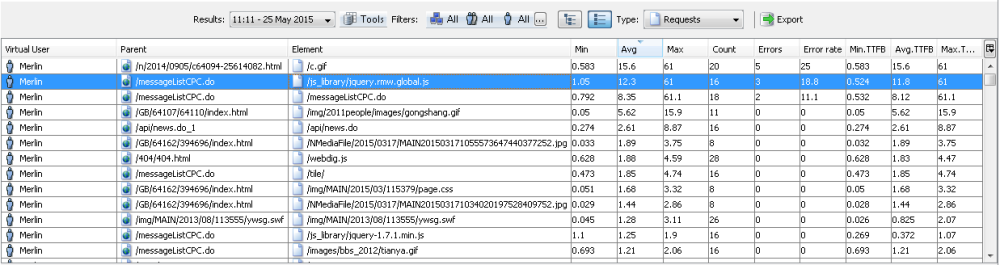
The Type drop-down list allows selecting the type of elements to be shown in the table: User Paths, Transactions, Pages, Requests, Media contents, Push messages, Actions, Counters, Indicators and external Data.
The built-in elements <all transactions>, <all pages>, and <all requests> display an overall view about the behavior of these element types.
A click on an element updates the performance graph beneath the table.
The layout of the list changes according to the Type filter selected.
- Tip: A right-click on an element in the table gives access to contextual commands.
The See in tree view command makes it possible to view the selected element in the scenario structure in the Values tab for further performance investigation. See View by element organization.
The See in design command displays the selected element in the scenario design for revision or correction. See User Paths.
- To view the performance values of an element type
- In the Results section, select the Values tab.
- Click the See values in list mode button.
- In the table, select an element to update the graph.
- When necessary, right-click the element type and:
- click See in tree view to view its performance in the scenario structure, or
- click See in design to view it in the scenario design.
View by element organization
In the Values tab, a click on the See values in tree mode button lists the elements of the test as organized at the design stage. The tab displays:
- the tree view of the scenario design and the performance of each tree item when selected
- the graph showing the performance of a parent or child element
Unfolding the tree shows a disassembled view of the test scenario: The + (plus) and - (minus) signs or the Expand all and Collapse all contextual commands unfold and fold a whole branch.
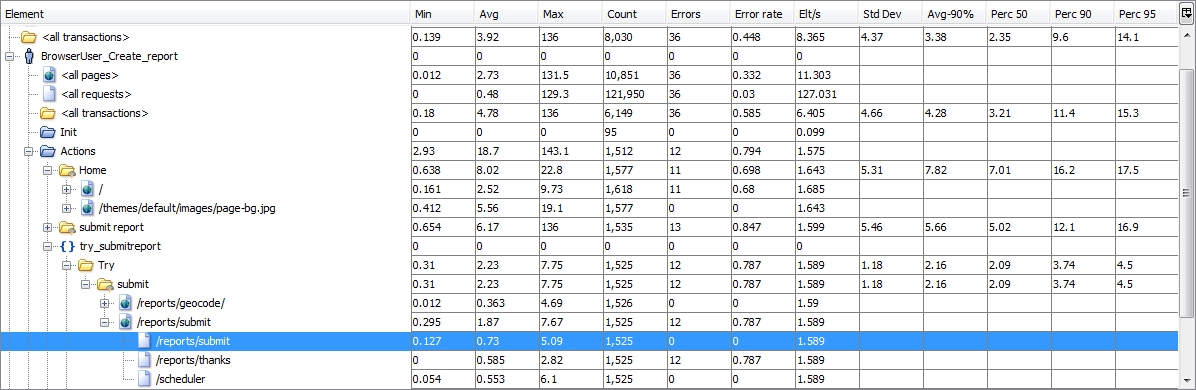
A click on any element in the tree updates the performance graph below, making it possible to pinpoint a defective element easily.
- Tip: A right-click on an element in the table gives access to contextual commands.
The See in list view command makes it possible to view the selected element along with the elements of the same type in the Values tab for comparison purpose. See View by element type.
The See in design command displays the selected element in the scenario design for revision or correction. See User Paths.
- To view the performance values of a test element
- In the Results section, select the Values tab.
- Click the See values in tree mode button.
- Browse through the tree with a click on the + (plus) and - (minus) signs or with the Expand all and Collapse all contextual commands.
- In the tree, select an element to update the graph.
- When necessary, right-click the element and:
- click See in list view to compare its performance with the other elements of the same type, or
- click See in design to view it in the scenario design.
Results Table
The Results table shows different statistics for:
- User Paths, Transactions, Pages, Requests, Media contents, Push messages, Actions
- Counters, Indicators, External Data
Virtual User statistics
- Min: Minimum response time.
- Avg: Average response time.
- Max: Maximum response time.
- Count: Total number of requests.
- Errors: Total number of failed requests.
- Error rate: Percentage of requests with errors out of the total number of requests.
- Elt/s: Number of iterations of the selected element per second.
- Std Dev: Standard deviation. (Advanced statistic, - is displayed when not computed).
Available for Transactions only, advanced statistic, "-" is displayed when not available).
- Avg-X%: The truncated mean. (Advanced statistic; - is displayed when the value has not been computed).
Available for Transactions only, advanced statistic, "-" is displayed when not available).
- Min TTFB: Minimum Time To First Byte (TTFB).
- Avg TTFB: Average Time To First Byte (TTFB).
- Max TTFB: Maximum Time To First Byte (TTFB).
- Perc X: values can go from 0.1 to 99.9 with 0.1 granularity (configurable in General Settings or in Results manager for a single test result).
Available for Transactions only, advanced statistic, "-" is displayed when not available).
- Perc Y: values can go from 0.1 to 99.9 with 0.1 granularity (configurable in General Settings or in Results manager for a single test result).
Available for Transactions only, advanced statistic, "-" is displayed when not available).
- Perc Z: values can go from 0.1 to 99.9 with 0.1 granularity (configurable in General Settings or in Results manager for a single test result).
Available for Transactions only, advanced statistic, "-" is displayed when not available).
- Tip: Right-click on an element name, such as a request or page, to switch to its definition in the User Paths.
Performance counter statistics
The statistics for performance counters are:
- Min: Minimum value for the counter.
- Avg: Average value for the counter.
- Max: Maximum value for the counter.
- Sev: The highest severity level of triggered alerts.
- % critical: Percentage of time spent at critical alert level.
- % warning: Percentage of time spent at warning alert level.
- Tip: Filter on the Sev column to identify quickly all the counters that triggered an alert.
Indicators
In the Values tab, the Type drop-down list makes it possible to choose Indicators. Indicators are performance counters that contain text information. For example, an indicator may contain text giving details of a database server version.
Advanced statistics
The advanced statistics include standard deviation, percentile and truncated mean. These statistics are available for containers only.
Plot curves
Select an HTTP request or web page to display the selected curves. Change the curves displayed for the selected element by checking or clearing the statistics check boxes. You may zoom on curves, as described in Zoom.
Right-click on a performance counter graph to hide/un-hide the alert zones and thresholds.
Export results data
In the Values tab, the Export button makes it possible to export data specifically or in bulk.
The elements to export can be selected in the Values tab before clicking Export. The first screen of the Export wizard helps select the elements to export and choose the results mode to consider.
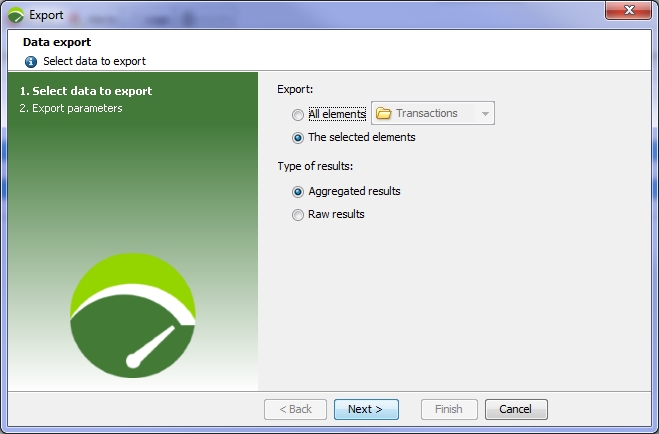
The Export group box helps choose the type of elements to include in the export file:
- The All elements option allows including all the elements which correspond to the element type selected in the drop-down list: Virtual Users, Containers, Pages, or else.
- When The selected elements is checked, all the elements previously selected in the Values tab are included in the export file.
The Type of results group box defines which results are published in the export file:
- Aggregated results compiles the results by the time interval defined in the test.
- Raw results captures the results of all the test iterations for the selected Containers.
A click on the Next button displays the second screen of the wizard where the CSV file must be defined.
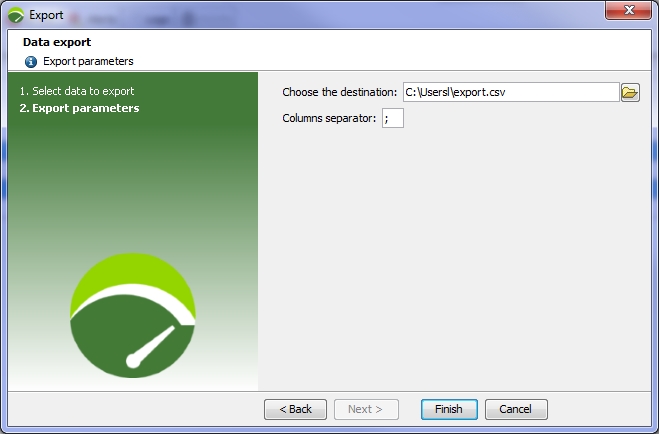
A click on the picker button of the Target file field makes it possible to specify the path and name of the CSV file. Although the semicolon mark is defined by default in Columns separator, another separator can be defined to comply with the parser that is used to read the CSV file after the export.
Clicking the Finish button generates the CSV file. A message box confirms that the export is complete.