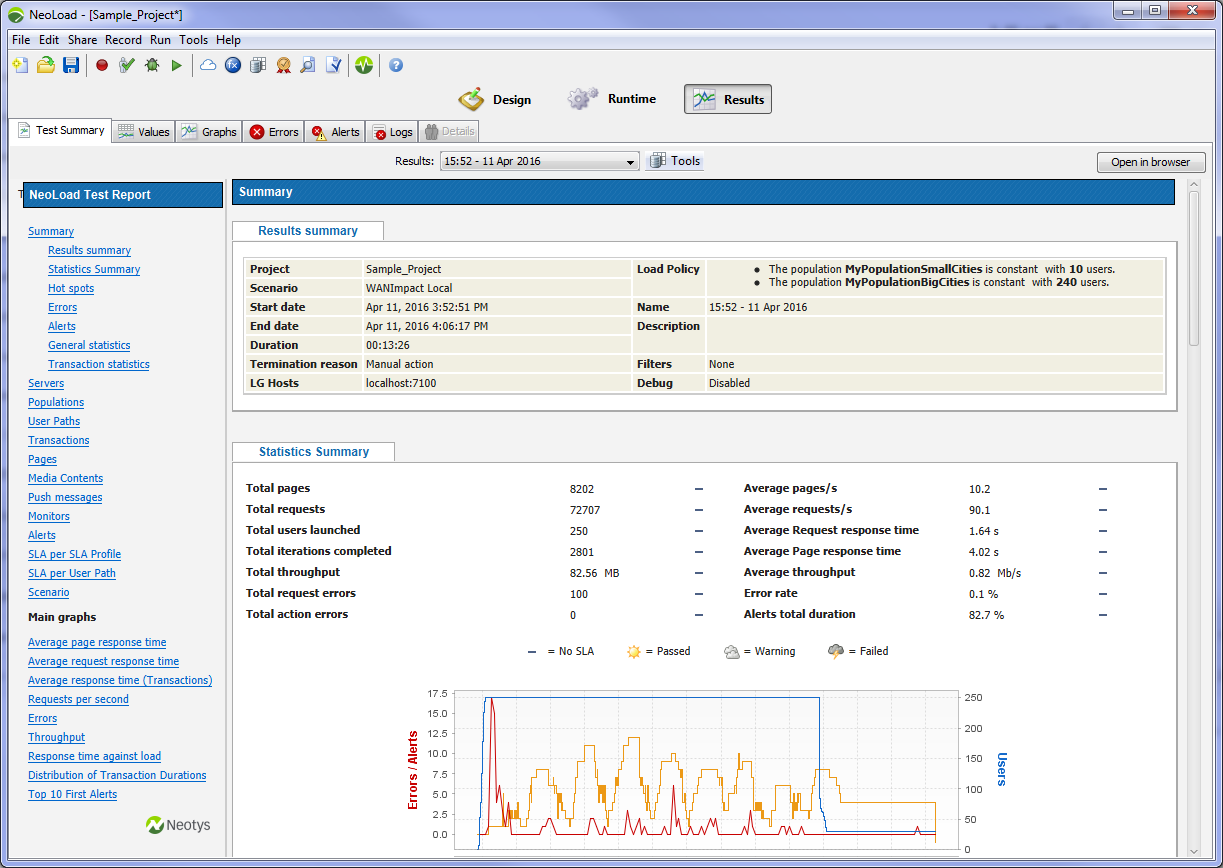
Test summary
The Test Summary tab contains all the main statistics for the test.
The Tools button allows generating a report for the selected test, among other functions. See Publish a test report.
Select a summary
To display a test result summary, a click on the Results drop-down list helps select a test.
Content
When a test is selected in the Results drop-down list, all the tabs in the Results section are updated.
Results summary
This tab displays basic details of the test: project and scenario name, test duration, load policy, and so on.
Statistics summary
The statistics summary displays the following global metrics:
- Total pages is the total number of pages played.
- Total requests is the total number of hits played.
- Total users launched is the total number of user instances launched.
- Total iterations completed is the sum of the number of times when the Actions Container is executed for each Virtual User.
- Total throughput is the sum of the sizes of the responses to all the requests played. (Does not include upstream).
- Total request errors is the total number of hits with errors.
- Total action errors is the total number of logical actions (e.g. JavaScript actions) with errors.
- Average pages/s is the average number of pages played per second.
- Average requests/s is the average number of hits played per second.
- Average request response time is the average of requests response times.
- Average page response time is the average of pages response times.
- Average throughput is the average throughput for server responses (downstream).
- Error rate is the percentage of hits with errors out of the total number of hits.
- Alerts total duration is the percentage of the total duration of alerts out of the total test duration.
An icon next to each statistic indicates the severity of the statistic discrepancy with regard to the SLA profile linked to the scenario.
Hot spots
This section focuses on significant results. The times are expressed in seconds.
Top 5 errors
This section lists the five pages having produced most of the errors.
Top 5 alerts
This section lists the five longest alerts filtered by alert importance (critical alerts first, followed by warning alerts). The duration is the duration of the different occurrences of an alert as a percentage of the total test duration.
First critical alerts
This section presents the first critical alerts occurring during the test run.
Top 5 average response times
This section lists the five pages having produced the longest average response times.
Top 5 maximum response times
This section lists the five pages having produced the longest maximum response times.
Top SQL requests
The section displays the results for indicators relating to SQL requests.
This section is available only when the appropriate performance indicators are used in the test. For example, any indicator in the Top SQL Statements category for the Oracle monitor. See Oracle DB monitor.
Errors
This section describes the errors encountered on requests and on logical actions generating errors (Javascript actions). For every type of error, it lists the error code, the number of requests or defective logical actions, and the error description label. For more information about NeoLoad error codes (beginning with NL-), see Neotys status codes. For more information about HTTP response codes, see HTTP status codes.
Every request or logical action can generate one error code only.
Alerts
This section displays the details of the alerts triggered. The section only displays elements with at least one alert threshold set. For each element, the following statistics are displayed:
- Alert severity level is a critical alert or a warning.
- Alert name
- Number of occurrences is the number of times the alert threshold was exceeded during the test run.
- Date of the first occurrence
- Alert duration in percentage of the total test running time
- Alert description
An icon is shown to indicate the state of each type of monitor with counters that have alert thresholds set:
- The
 icon indicates that the counters triggered at least one critical alert.
- The
 icon indicates that the counters triggered at least one warning alert but no critical alerts.
- The
 icon indicates that the counters triggered no critical or warning alerts.
Cloud
Three available views:
Map
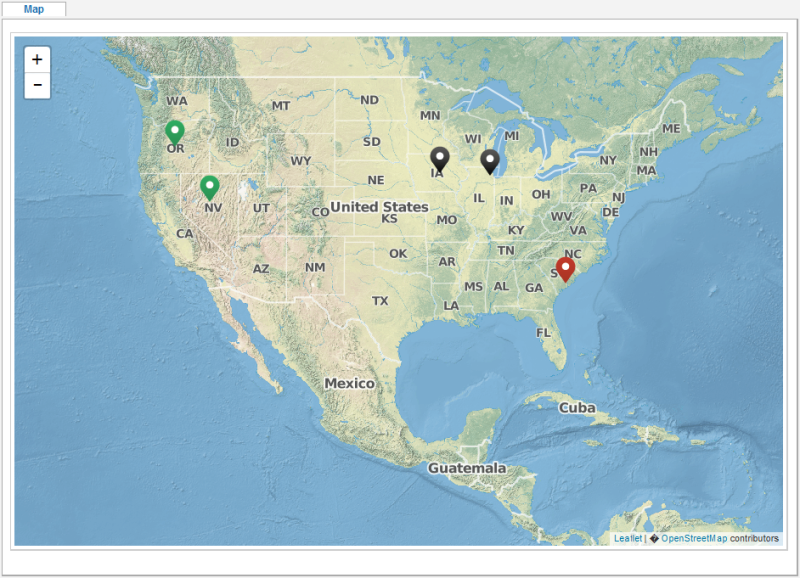
Displays statistics in relation to the geographical areas.
The map is displayed with the summary of the zones.
Zones are identified by an icon that changes color (Green, Black, Red) or size depending on the number of Load Generators.
- The icon is green if the zone statistics are better than the global statistics.
- The icon is red if the zone statistics are not as good as the global statistics.
- The icon is black in all other cases.
There are four sizes of icons in relation to the distribution in percentage of the Load Generators. The icon size increases by 25% increments.
On the map, click on the icon of the zone to query in order to display the zone statistics and a graph on:
- Requests/s is the number of requests (hits) played per second for the test duration.
- Response time (s) is the average response time per page in seconds.
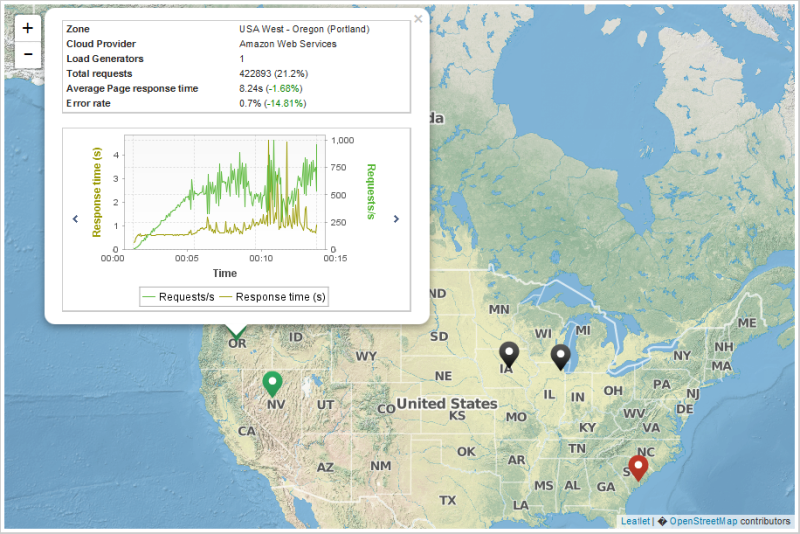
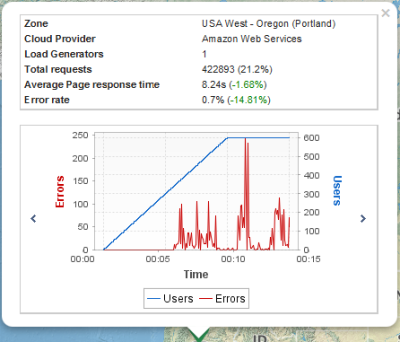
The second graph illustrates:
- Users represents the evolution of the number of Virtual Users.
- Errors represents the number of errors per sampling interval.
Graphs
Two available graphs:
- Response time is the average response time of the pages.
- Errors represents the number of errors per sampling interval.
Statistics
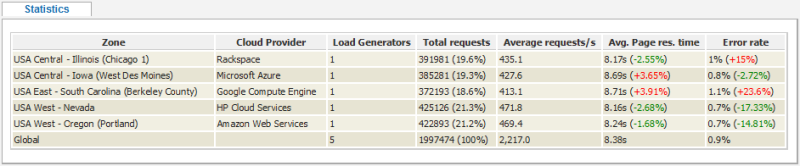
The table indicates for each zone, the following information:
- Cloud Provider is the Cloud supplier name. This information is retrieved during the creation of a Cloud session.
- Load Generators is the number of Load Generators per zone.
- Total requests is the total number of hits.
- Average requests/s is the average number of hits played per second.
- Average Page res. time is the average of pages response times.
- Error rate is the percentage of requests with errors out of the total number of requests.
General statistics
This section displays the following aggregated statistics for all User Paths, pages and requests:
- Min: Minimum response time
- Avg: Average response time
- Max: Maximum response time
- Count: Total number of requests
- Err: Total number of errors
- % of Err: Percentage of errors
- SLA Profile and highest severity encountered
Transaction statistics
This section displays the following aggregated statistics for all Transactions:
- Min: Minimum response time
- Avg: Average response time
- Max: Maximum response time
- Count: Total number of requests
- Err: Total number of errors
- % of Err: Percentage of errors
- Perc-X: values can go from 0.1 to 99.9 with 0.1 granularity (configurable in General Settings or in Results manager for a single test result).
- Perc-Y: values can go from 0.1 to 99.9 with 0.1 granularity (configurable in General Settings or in Results manager for a single test result).
- Perc-Z: values can go from 0.1 to 99.9 with 0.1 granularity (configurable in General Settings or in Results manager for a single test result).
- Std Dev: standard deviation
- Avg-X%: the truncated mean (configurable in General Settings or in Results manager for a single test result).
- SLA Profile and highest severity encountered
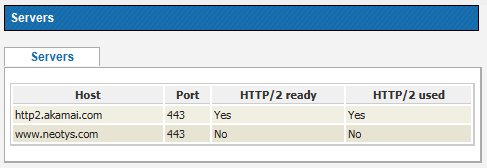
Servers
This section displays the following information for all servers used during the test:
- Host: displays the name of the server.
- Port: displays the port opened for the server.
- HTTP/2 ready: When HTTP/2 is enabled on the browser profile, HTTP/2 ready shows a green tick if the server is HTTP/2-compliant; otherwise it shows a red cross. This information is not available when HTTP/2 is disabled on the browser profile.
- HTTP/2 used: shows a green tick when the HTTP/2 protocol has been used at least once on the specified server during validation.
Populations
This section displays statistics per population:
- Total requests: Total number of hits.
- Average requests/s: Average number of hits played per second.
- Avg. Page res. time: Average number of pages response times.
- Error rate: Percentage of requests with errors out of the total number of requests.
User Path, Transactions, push messages and pages
The following statistics are displayed for each User Path, Transaction, push message and web page:
- Min: Minimum response time
- Avg: Average response time
- Max: Maximum response time
- Count: Total number of requests
- Err: Total number of errors
- % of Err: Percentage of errors
- SLA Profile and highest severity encountered
Media contents
For every media request, the following statistics are displayed:
- Count is the number of times when the request was executed.
- Errors is the number of errors received.
- Bitrate is the average bitrate used to simulate the media.
- Played Time is the total time spent on simulating the media content.
- Lag Duration is the time spent on downloading the content without simulating the media.
- Lag Ratio is the ratio between the lag length and the total play time (can be above 100%).
- Fill Buffer Duration is the time spent to fill in the buffer when starting the video.
The statistics are displayed per Virtual User.
Monitors
- Min: Minimum response time
- Avg: Average response time
- Max: Maximum response time
- Med: Median response time
- Avg-X%: Truncated mean (configurable in General Settings or in Results manager for a single test result).
- Std Dev: Standard deviation
External data
Overview
This section allows displaying external data received during the execution of a Custom action.
NeoLoad sets up a data exchange server which receives external data.
For more information on the data exchange server configuration, refer to the Data Exchange API User Guide.
Result qualification
Some external data entries have a pass or fail status.
When a request is not subject to a Pass or Fail condition, it is displayed with the status: Unknown (example: Battery Level %).
Display
- Display of results
NeoLoad displays the results in two tables.
- The first table groups data by platform, client software, location and script.
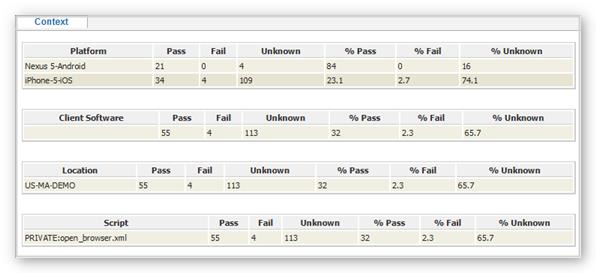
- Platform is the name identifying the external platform that processes the scripts.
- Client Software is the name identifying the client software that processes the script. If there is no information, NeoLoad nevertheless displays the statistics line and displays an empty cell for the name of the client software.
- Location is the name identifying the geographical place where the platforms execute the scripts.
- Script is the name of the script executed on the platform.
- Pass is the number of times where an action was executed successfully.
- Fail is the number of times where an action was executed unsuccessfully.
- Unknown is the number of times an action was executed without a specific pass or fail status.
- % Pass is the ratio of the number of Pass values received compared with the sum of Pass, Fail and Unknown.
- % Fail is the ratio of the number of Fail values received compared with the sum of Pass, Fail and Unknown.
- % Unknown is the ratio of the number of Unknown values received compared with the sum of the Pass, Fail and Unknown.
- The second table lists all the requests executed per script.
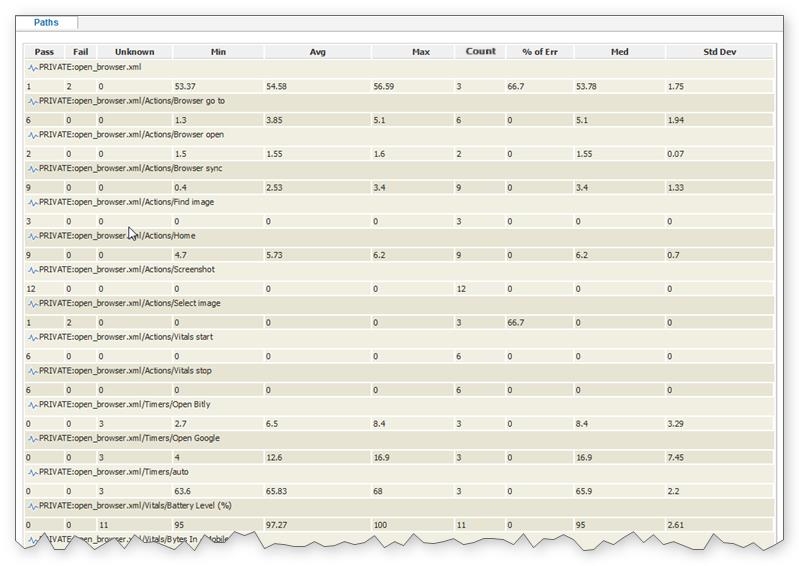
- Pass is the number of times the request was executed successfully.
- Fail is the number of times the request was executed unsuccessfully.
- Unknown is the number of times the request was executed and the result was neither pass nor fail.
- Min is the minimum value measured during the tests.
- Avg is the average calculated value.
- Max is the maximum value measured during the tests.
- Count is the number of requests received for an action.
- % of Err is the number of errors in relation to the total number of requests.
- Med is the median value.
- Std Dev is the standard deviation.
Scenario
This section shows a summary of the test scenario configuration, with the following information:
- Results summary
- Populations and their User Paths configuration
- User Paths and their configuration
- Rendezvous policies
- SLA profiles
Main graphs
This section includes a collection of predefined graphs:
- Average page response time: the average response time, in seconds, of all pages
- Average request response time: the average response time, in seconds, of all requests
- Average response time (Transaction): the average response time, in seconds, of all transactions
- Requests per second: the number of requests on the server by Virtual Users
- Errors: the number of elements in error (requests and/or actions) per sampling interval
- Throughput: the number of megabits of data per second returned by the server
- Response time against load: the average response time, in seconds, of all pages according to the number of simultaneous Virtual Users
- Distribution of Transaction durations: the percentage of Transactions performed within a given time range
- Top 10 First Alerts: the list of the 10 most frequent alerts on the monitored counters