Portal performance testing example
- Overview
- Tasks
- Analysis Tools
- Large pages
- Heap size tuning
- Session timeout
- Data Source Tuning
- Nursery Size
- Shared Class Cache Size
- MaxDirectMemorySize
- iprofileMemoryConsumptionLimit
- -XtlhPrefetch (Software Prefetch)
- iprofileMemoryConsumptionLimit
- Web Container Thread Pool Size
- ORB thread pool size
- Prepared statement cache size
- Avoid refetching static content after login
- VMM Context Pool
- VMM Caches
- Disable tagging and rating
- Mashup multipart tuning
- Enable Caching of ra:collecton URLs
- Disable Portlet Capability Filter
- Disable JCR Text Search
- Site Toolbar
- Get Rid of Cache Invalidations
- Disable Portlet Capability Filter
- Navigator Service
- Registry Service
- DRS replication modes
- Cache Manager
- Reduce the Size of unused caches
- Cache sizes
- Disable Search
- Disable personalization visibility rules
- Disable PZN Preprocessor
- Federated LDAP
- DB2 server
- IBM Tivoli Directory Server tuning
- IHS Tuning
- Network Tuning
- WCM Object Cache
- WCM Cache Manager Service
- Access Control Data Management Service
- Enable servlet and portlet caching
- Web Content Viewer Portlet Caching
- My Connections
- Web Services Clients
- Enable Subscriber only
- Monitor the WCM Content Viewer Portlet Cache
- Analyze garbage collection
- Execute concurrency test
- Execute throughput test
- Soak test
- Execute stress test
- Appendix
- nmon logging
- Memory and paging
- Think time
- Saturation
- Monitor JVM logs
- Get AIX statistics using nmon
- iostat
- svmon
- TCP_TIMEWAIT
- Monitor LDAP
- Tune dynamic cache with the cache monitor
- Web Server Plug-In Analyzer
- Monitor plug-in maximum number of connections
- Memory leaks
- Look for database contention
- Enable server-status
- Set cloneIds
Overview
For this example, objectives include...
- Find and remove bottlenecks that throttle throughput.
- Determine the load level at which a system under test fails
- Predict horsepower required for future user loads
Estimated concurrent users is 30,000/hr. System is running AIX v7.1 64-bit operating, using TDS LDAP and DB2 database. After implementing various tuning changes below, execute use cases to determine if new setting has improved or degraded performance. We use Rational Performance Tester to generate load and reports. authenticated access, verify sufficient unique test user IDs exist in the LDAP. The portal artifacts are generally cached on a per-user basis. If the load simulation uses the same user ID for all tests, performance appears artificially high because the artifacts do not need to be loaded from the LDAP directory and the database.
Testing tasks
Pre-test
| Task | Resource | Status | Notes |
|---|---|---|---|
| Define objectives | Team | | |
| Create Rational Performance Tester tests | Tester | | |
| Enable PMI in WAS console | Middleware | | |
| Verify trace is disabled | Middleware | | |
| Install IBM Support Assistant | Middleware | | |
| Enable Web Server Status | Middleware | | |
| Enable extended PMI Metrics | Middleware | | |
| Configure TPV log settings | Middleware | | |
| Install Cache Monitor | Middleware | We get baseline measurements first, then enable caching and install monitor. |
Tests
| Task | Resource | Status | Notes |
|---|---|---|---|
| Concurrency | Tester | | |
| Throughput | Tester | | |
| Soak | Tester | 2-3 days. Look for memory leaks | |
| Stress | Tester | |
Primary monitoring
| Task | Resource | Status | Notes |
|---|---|---|---|
| Req/sec | Middleware | | |
| Resp time | Middleware | | |
| Advice | Middleware | | |
| Data Source | Middleware | Pool Size, Percent Used | |
| Prepared statement cache size | Middleware | PrepStmtCacheDiscardCount | |
| Web Container Thread Pool size | Middleware | PercentMaxed, ActiveCount | |
| ORB thread pool size | Middleware | PercentMaxed |
Baseline Tuning
We applied these tuning parameters after the first baseline metrics are collected.
| Task | Resource | Status | Notes |
|---|---|---|---|
| Enable servlet and portlet caching | Middleware | | |
| Large pages | Middleware | | |
| Heap size | Middleware | Set initial and maximum heap size to 3584 | |
| Session timeout | Middleware | | |
| Disable tagging and rating | Middleware | | |
| Mashup multipart tuning | Middleware | | |
| Enable Caching of ra:collecton URLs | Middleware | | |
| Disable Portlet Capability Filter | Middleware | | |
| Disable JCR Text Search | Middleware | | |
| Enable Subscriber Only | Middleware | | |
| Navigator Service | Middleware | | |
| Registry Service | Middleware | | |
| Cache Manager | Middleware | | |
| WCM Object Cache | Middleware | | |
| Web Content Viewer Portlet Caching | Middleware | | |
| My Connections | Middleware | | |
| Web Services Clients | Middleware | |
Other Tuning
These tuning parameters will be set after analysis of test results
Secondary monitoring
| nmon | Middleware | NA_UserGuide v34.doc, nmon_analyzer.xls | |
| WCM Content Viewer portlet cache | Middleware | | |
| Analyze garbage collection | Middleware | | |
| Monitor cache | Middleware | ||
| Monitor JVM logs | Middleware | No testing if fatal errors exist. | |
| Monitor disk I/O | Middleware | nohup iostat 15 240 > /tmp/iostat.txt & | |
| Monitor AIX physical memory usage | Middleware | vmstat 10 360 > /tmp/vmstat.txt 2>1 & | |
| Monitor AIX virtual memory | Middleware | | |
| Monitor TCP_TIMEWAIT | Middleware | | |
| Monitor LDAP | Admin | ||
| Monitor for core dumps | Middleware | $WP_PROFILE/javacore.* | |
| Thread and Monitor Dump Analyzer | Middleware | Optional | |
| HeapAnalyzer | Middleware | Optional | |
| Database Connection Pool Analyzer | Middleware | Optional | |
| Look for database contention | Middleware | Optional | |
| Dynamic Cache Statistics Collector | Middleware | Optional | |
| Set cloneIds | Middleware | Optional | Send traffic to a particular server for debugging. |
| Portlet load monitoring | Middleware | Optional | |
Monitor IHS
| Task | Resource | Status | Notes |
|---|---|---|---|
| Monitor CPU, I/O, memory and paging | Middleware | ||
| Monitor TCP/IP | Middleware | netstat | |
| Web server access_log | Middleware | grep DD/Mon access_log | grep -v 200 | grep -v 302 | |
| Monitor virtual memory | svmon |
Monitor: Plug-in
| Task | Resource | Status | Notes |
|---|---|---|---|
| Monitor plug-in maximum number of connections | Middleware | | |
| Monitor for marked down servers | Middleware | | |
| Web Server Plug-In Analyzer | Middleware | |
Analysis Tools
| yslow | Analyze web pages |
| Extended Cache Monitor | A WAS utility that provides statistics (number of entries used, cache hit ratio, etc.) on the DynaCache instances. |
| IBM Support Assistant (ISA) Workbench | Various Java-based tools to analyze thread dumps and verbose garbage collection (GC) output, specifically, "IBM Thread and Monitor Dump Analyzer for Java" and "IBM Monitoring and Diagnostic Tools for Java - Garbage Collection and Memory Visualizer". |
| Cache Viewer Portlet | A WebSphere Portal Server portlet (provided by IBM Support) that provides additional information about the internal caches used by Portal. |
| Fiddler | A free tool that breaks down the response timeline from the end-user's perspective. |
| Page & Portlet Render Timers | Displays server-side page and portlet render times for a given page, making it easy to identify the "long poles" in terms of the slowest portlets on the page. |
| Portlet Load Monitoring Filter | Limit the number of concurrent requests and the average response time allowed for JSR 168 or JSR 286 portlets. If a portlet exceeds either the defined maximum number of concurrent requests, or the average response time, then Portlet Load Monitoring no longer allows further requests by the portlet. Instead, the portal renders the portlet as unavailable, and the portlet code is no longer called for further requests. This way, the Portal installation is protected from non-responsive portlets consuming an increasing number of threads. |
| Network Traces | Use tcpdump or snoop to capture packets to and from the various servers. |
| Wireshark | Analyze the network trace output files obtained from tcpdump and snoop. |
| J2EE Monitoring Tool | Optional. ITCAM, CA's Introscope, and HP Diagnostics. Provides insight into where the time is spent from a JVM perspective. |
Large pages
IBM has measured a 10% throughput improvement after enabling large pages. To set...
- Go to...
-
Servers | Server Types | WebSphere appservers | WebSphere_Portal | Server Infrastructure: Java and Process Management | Process Definition | Java Virtual Machine
...and add -Xlp to the Generic JVM Arguments field
- Allocate 4GB of RAM as large pages of 16MB each.
vmo -r \ -o lgpg_regions=288 \ -o lgpg_size=16777216 bosboot \ -ad /dev/ipldevice reboot \ -q - Reboot the system
- After reboot, enable large page support.
-
vmo -p -o v_pinshm=1
This setting persists across reboots
For portals running under a non-root user id, grant large page usage to that user...
-
chuser capabilities=CAP_BYPASS_RAC_VMM,CAP_PROPAGATE portal_user
- Restart the Portal Server.
- Verify large pages are being used, run...
-
vmstat -l 1 5
...and verify alp column (active large pages) is a non-zero value.
wasadmin@prodline2wps1 / ->vmstat -l 1 5
 System configuration: lcpu=16 mem=16384MB ent=2.00
 kthr    memory              page              faults              cpu           large-page
----- ----------- ------------------------ ------------ ----------------------- -----------
 r  b   avm   fre  re  pi  po  fr   sr  cy  in   sy  cs us sy id wa    pc    ec   alp   flp
 1  0 1352547 2419795   0   0   0   0    0   0 109 6101 1702  5  1 94  0  0.19   9.5     0     0
 2  0 1352547 2419795   0   0   0   0    0   0 127 3655 1921  4  1 96  0  0.15   7.3     0     0
 1  0 1352547 2419795   0   0   0   0    0   0  79 6171 2028 10  1 89  0  0.28  13.8     0     0
 1  0 1352547 2419795   0   0   0   0    0   0  37 2985 1619  5  1 94  0  0.17   8.5     0     0
 5  0 1352547 2419795   0   0   0   0    0   0  64 2192 1820  1  1 99  0  0.05   2.5     0     0
- In portal, change to 64K page size for text (TEXTPSIZE) and stack (P1ACKPSIZE), and 16MB page size for data area (DATASIZE). Go to...
-
Servers | Server Types | WebSphere appservers | WebSphere_Portal | Server Infrastructure: Java and Process Management | Process Definition | Environment Entries | New
...and set...
Name LDR_CNTRL Value P1ACKPSIZE=64k@TEXTPSIZE=64k@DATAPSIZE=16MB
Heap size tuning
For IBM WebSphere Portal v8, running on AIX 64-bit, IBM recommends generational concurrent (gencon) garbage collection (enabled by default), with both Initial Heap Size and Maximum Heap Size set to 3584...
-
Servers | Server Types | WebSphere appservers | WebSphere_Portal | Server Infrastructure: Java and Process Management | Process Definition | Java Virtual Machine
To force verbosegc log rolling...
-
-Xverbosegclog:{SERVER_LOG_ROOT}/verbosegc#.log,5,10000
To monitor, download logs...
-
/opt/IBM/Portal/WAS1/wp_profile/logs/WebSphere_Portal/verbosegc*.log
...and run them through the IBM Pattern Modeling and Analysis Tool for Java Garbage Collector (part of IBM Support Assistant). Verify system is spending no more than 10% of time in garbage collection. If verbosegc.log indicates a large number of mark stack overflows (MSOs), to override the default, and provide additional mark stack space, set -Xgcthreads
To cause any Java object allocations greater than 1M to be recorded in native_stderr.log, go to...
-
Servers | Application Servers | WebSphere_Portal | Java and process management | Process definition | Java Virtual Machine | Custom properties
...and set...
-
ALLOCATION_THRESHOLD = 1000000
For Out of Memory errors that coincide with large object allocations when verbosegc.log shows plenty of available heap, fragmentation is the likely culprit. To fix, set -Xloratio0.1.
Session timeout
-
Servers | Server Types | WebSphere appservers | WebSphere_Portal | Container Settings: Web Container Settings | Session Management | Session Timeout
Set Timeout: 15 minutes
Data Source Tuning
Initial setting, go to...
-
Resources | JDBC Providers | provider name | Data Sources | wpdbDS_jcr | Connection pool properties
...and set...
- Maximum connections: 150
- Minimum connections: 10
To monitor, in TPV, under the JDBC Connection Pools module, watch...
- Pool Size
- Percent Used
If Percent Used counter is consistently low, decreasing the number of connections in the pool. If high, increase. Lower settings for the connection pool size (10-30 connections) typically perform better than higher settings (more than 100). When threads are waiting on JDBC pool resources in WAS, you see the threads in a condition wait (CW) state in the WAS connection pool (J2C) classes. In this case, we might need to increase the pool size for this data source.
Nursery Size
IBM recommends increasing nursery size from the default. To set...-
Servers | Server Types | WebSphere appservers | WebSphere_Portal | Server Infrastructure: Java and Process Management | Process Definition | Java Virtual Machine
...and add -Xmn1024m to the Generic JVM Arguments
Shared Class Cache Size
By default, WAS enables a 50 MB class data sharing cache. For portal performance, IBM recommends setting to 120MB. To set...
- From the WAS console, go to...
-
Servers | Server Types | WebSphere appservers | WebSphere_Portal | Server Infrastructure: Java and Process Management | Process Definition | Java Virtual Machine
...and add -Xscmx150m to the Generic JVM Arguments field
- Stop Portal server
- From command-line...
-
cd AppServer root/java/bin
./java -Xshareclasses:name=webspherev80_%g,groupAccess,destroyTo determine the name of the shareclasses we need to use for your platform and release. Search we need to use, search native_stderr.log and look for...
-
Xshareclasses:name=
- Look for the message...
-
JVMSHRC010I Shared cache "webspherev80xxx" is destroyed. Could not create the Java virtual machine.
- Start Portal Server
- Check cache size in use
-
./java -Xshareclasses:name=webspherev80_%g,groupAccess,printStats
MaxDirectMemorySize
MaxDirectMemorySize sets an upper bound on the amount of native memory allocated for DirectByteBuffers. This allows the system to avoid GC cleanup before growing the amount of physical memory allocated for these buffers.
To start, IBM recommends setting.
-
-XX:MaxDirectMemorySize=256M
After increasing, monitor for paging and memory leaks.
iprofileMemoryConsumptionLimit
The JIT compiler, by default, has a memory limit of 18MB. After reaching this limit, further JIT profiling stops and JIT compilation will not be optimal. IBM recommends setting...
-
-Xjit:iprofilerMemoryConsumptionLimit=67108864
To monitor...
- In the WAS console, go to...
-
Server Types | WebSphere appservers | WebSphere_Portal | Server Infrastructure: Java and Process Management | Process Definition | Environment Entries
...and set...
Name TR_PrintCompStats Value 1 - Go to...
-
Server Types | WebSphere appservers | WebSphere_Portal | Server Infrastructure: Java and Process Management | Process Definition | Java Virtual Machine
...and add...
-Xjit:verbose={compile*},verbose={failures},vlog=/{wp_profileRoot}/logs/WebSphere_Portal/vlog.txt,stopOnFailure,iprofilerVerbose,iprofilerMemoryConsumptionLimit=67108864 - Start Portal
- Run a performance measurement.
- Stop the Portal server; do not kill it
- Find the following in native_sderr.log.
The text in red shows that 32MB is needed, so the limit needs to be set higher than that value for optimal performance.
-
JIT memory usage
_heapSegMemory=37827 KB
_stackSegMemory=5184 KB
_freeSegMemory=12385 KB
_maxHeapSegMemory=173963 KB
_maxStackSegMemory=960 KB
_persistentSegMemory=82062 KB (IProfiler=33526 KB CHTable=4145 KB Assumptions=0 KB)
_livePersistentSegMemory=82062 KB
_livePersistentUsedMemory=82048 KB
-XtlhPrefetch (Software Prefetch)
This Generic JVM Argument prefetches bytes in the thread local heap ahead of the current allocation pointer during object allocation. It helps reduce the performance cost of subsequent allocations. Use it for AIX 64-bit JDK.
iprofileMemoryConsumptionLimit
The portal log may contain the following warnings after a long period of heavy usage:
-
000000f3 AlarmThreadMo W UTLS0008W: The return of alarm thread "Non-deferrable Alarm : 2" (0000003b) to the alarm thread pool has been delayed for 32480 milliseconds.
These messages are spurious and can be disabled by setting the following Generic JVM argument...
-
-Dcom.ibm.websphere.alarmthreadmonitor.threshold.millis=xxxxx
...where xxxxx is greater than the number of milliseconds mentioned in the error message, for example 40,000.
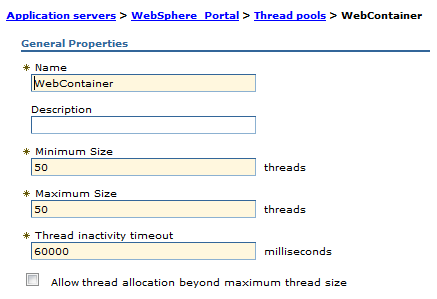
Web Container Thread Pool Size
In the TPV Thread Pools module watch...
- PercentMaxed
- ActiveCount
If value PercentMaxed counter is consistently in the double digits, the web container can be a bottleneck, and we need to increase the number of threads. If the number of active threads are significantly lower than the number of threads in the pool, consider lowering the thread pool size.
To set...
-
Servers | Server Types | WebSphere appservers | WebSphere_Portal | Additional Properties: Thread Pools | Web Container | Thread Pool
Current settings:
ORB thread pool size
To monitor, in TPV, under the Thread Pools module, watch the PercentMaxed counter. If the value of this counter is consistently in the double digits, the ORB might be a bottleneck, and we need to increase the number of threads in the pool.
To configure the ORB thread pool size...
-
Servers | Application servers | appserver | Container Services | ORB Service | Thread Pool | Maximum Size
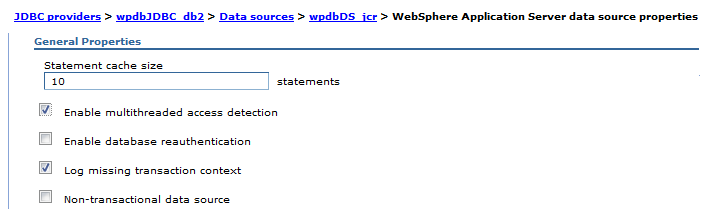
Prepared statement cache size
Watch the PrepStmtCacheDiscardCount counter of the JDBC Connection Pools module. Goal is to get lowest value possible.
To set cache size...
-
Resources | JDBC Provider | scope (cell, node or server | provider_name | Additional Properties | Data Sources | data source | WebSphere Application server data source properties | Statement cache size
Current settings for JCR data source...
Avoid refetching static content after login
With the Portal 8.0 theme many resources do not change before and after logging in. These resources include the ra: collection URLs that are part of the theme. The same URL can safely be used for authenticated and unauthenticated users.
To set, check...
-
Security | Global security | Web and SIP security | General Settings | Use available authentication data when an unprotected URI is accessed
VMM Context Pool
Tune the VMM Context Pool to improve the performance of concurrent access to an LDAP server.
-
Security | Global security | Available realm definitions | Federated Repositories | Configure | LDAP Repository Identifier | Additional Properties | Performance
To set manually, edit...
-
wp_profile_root/config/cells/
...and change the contextPool settings to..
<config:contextPool enabled="true" initPoolSize="10" maxPoolSize="30" poolTimeOut="0" poolWaitTime="3000" prefPoolSize="30"/>
To monitor the number of active LDAP connections...
-
netstat -an | grep 389 | wc -l
VMM Caches
To tune VMM search...
-
Security | Global security | Available realm definitions | Federated Repositories | Configure | LDAP Repository Identifier | Additional Properties | Performance
To set manually, edit...
-
wp_profile_root/config/cells/
If there are more than 6000 concurrent users, set...
<config:searchResultsCache cacheSize="12000"
             cacheTimeOut="1200" enabled="true" searchResultSizeLimit="1000"/>
...and change the attributesCache settings to...
<config:attributesCache attributeSizeLimit="2000" cacheSize="12000" cacheTimeOut="1200" enabled="true"/>
Disable tagging and rating
Disabling tagging and rating can improve capacity by 3%.
To disable, go to...
-
Resources | Resource Environment | Resource Environment Providers | WP CPConfigurationService | Custom properties
...and set...
| com.ibm.wps.cp.tagging.isTaggingEnabled Value | false |
| com.ibm.wps.cp.rating.isRatingEnabled Value | false |
Mashup multipart tuning
The Portal 8.0 theme multipart downloading can be disabled to improve performance. Disabling may cause performance issues on client side aggregation themes from earlier Portal releases.
To disable, go to...
-
Resources | Resource Environment | Resource Environment Providers | WP CommonComponentConfigService | Custom properties
...and set...
| cc.multipart.enabled | false |
Enable Caching of ra:collecton URLs
Go to...
-
Resources | Resource Environment | Resource environment Providers | WP_ConfigService
...and set...
-
resourceaggregation.cache.markup: true
Disable Portlet Capability Filter
The portlet capability filter allows developers to get friendly error messages on pages if the theme profile in place for a page does not contain all the capabilities the portlets on the page require. In production this filter should be disabled.
To disable, go to...
-
Resources | Resource Environment | Resource Environment Providers | WP ConfigService | Custom properties
...and set...
| resourceaggregation.enableRuntimePortletCapabilitiesFilter | false |
Disable JCR Text Search
Go to...
-
WebSphere Portal Administration | Manage Search | Search Collections
...and delete all JCR collections.
Edit...
-
wp_profile>/PortalServer/jcr/lib/com/ibm/icm/icm.properties
...and set...
-
jcr.textsearch.enabled: false
Site Toolbar
For rendering only sites where page management is not taking place locally, the Site Toolbar can be disabled.
To disable, go to...
-
Resources | Resource Environment | Resource Environment Providers | WP VirtualPortalConfigService
...and set...
| global.toolbar.enabled | false |
| default.toolbar.enabled | false |
Get Rid of Cache Invalidations
To reduce unnecessary cache invalidations, go to...
-
Resources | Resource Environment | Resource Environment Providers | WP ConfigService | Custom properties
...and set...
| cache.dynamic.content.spot | false |
Run benchmarks to determine if the net effect is positive.
Disable Portlet Capability Filter
The portlet capability filter allows developers to get friendly error messages on pages if the theme profile in place for a page does not contain all the capabilities the portlets on the page require. In production this filter should be disabled.
To disable, go to...
-
Resources | Resource Environment | Resource Environment Providers | WP ConfigService | Custom properties
...and set...
| resourceaggregation.enableRuntimePortletCapabilitiesFilter | false |
Navigator Service
The navigator service content model is periodically reloaded by WebSphere Portal. In a production environment where new pages for unauthenticated users are rarely created, setting this reload time to an hour or more will give better performance.This service also controls the HTTP cache-control headers which will be sent on unauthenticated pages. Increasing these cache lifetimes in a production environment can reduce load.
To increase, go to...
-
Resources | Resource Environment | Resource Environment Providers | WP NavigatorService | Custom properties
...and set...
| public.expires | 3600 | Cache expiration time in seconds, for unauthenticated pages in browser caches and proxy caches. |
| public.reload | 3600 (seconds) | Reload interval, in seconds, for internal cache of the list of pages visible to unauthenticated users. |
| remote.cache.expiration | 28800 (seconds) | Cache expiration, in seconds, for caches outside of portal server for authenticated and unauthenticated pages |
Registry Service
Portal uses the registry service to replicate information about resource types into memory. This replicated information is periodically reloaded. In a production environment, we expect this type of information changes very infrequently, so we set a very long reload time.
To increase replication interval, go to...
-
Resources | Resource Environment | Resource Environment Providers | WP RegistryService | Custom properties
...and set...
| default.interval | 28800 | Reload frequency for any object types not explicitly specified in the file. |
| bucket.transformation application.interval | 28800 | Reload frequency for transformation application definitions |
| bucket.transformation. interval | 28800 | Reload frequency for transformation definitions |
DRS replication modes
WebSphere Portal requires the WAS Dynamic Cache Service (dynacache) and cache replication be enabled. The default mode of replication, PUSH, can cause performance problems in the portal environment. WebSphere Portal V6.0.1.5 and V6.1 change the default for all Portal and WCM dynacaches to be NOT SHARED instead of PUSH.
The use of NOT SHARED is strongly recommended for the vast majority of WebSphere Portal configurations. Three actions are needed to ensure that each Portal cluster member is fully optimized for WebSphere Portal V6.0.1.4 and earlier. The first is to set the replication mode to NOT SHARED using the WAS console for each cluster member. The second is to install Portal PK64925. The third is to install WMM PK62457 and add the parameter cachesSharingPolicy with a value of NOT_SHARED to the LDAP section of the wmm.xml files on each node. We can check out further details here.
WCM dynacaches also should be set to NOT SHARED with the exception of the "menu" cache. To complete this task, in the dmgr console, navigate to...
-
Resources | Cache Instances | Object Cache Instances
...and change each of the individual cache instances to a mode of NOT SHARED. As of the time of this writing, there are 11 instances for WebSphere Content Manager.
Finally, there are WAS changes that can further, although marginally, reduce the amount of network traffic between cluster members due to replication events. For each cluster member (either WCM or portal), navigate to...
-
Servers | Application Servers | WebSphere_Portal | Java and process management | Process definition | Java Virtual Machine | Custom properties | New
...and define the following properties:
-
com.ibm.ws.cache.CacheConfig.filterLRUInvalidation=true
com.ibm.ws.cache.CacheConfig.filterTimeOutInvalidation=true
com.ibm.ws.cache.CacheConfig.cacheInvalidateEntryWindow=2
com.ibm.ws.cache.CacheConfig.cacheEntryWindow=2
Cache Manager
To set, go to...
-
Resources | Resource Environment | Resource Environment Providers | WP CacheManagerService | Custom properties
...and set...
| cacheinstance.com.ibm.wps.ac.AccessControlUserContextCache.size | 6000 | |
| cacheinstance.com.ibm.wps.ac.ChildResourcesCache.lifetime | 28800 | |
| cacheinstance.com.ibm.wps.ac.CommonRolesCache.size | 33000 | |
| cacheinstance.com.ibm.wps.ac.ExternalOIDCache.lifetime | -1 | |
| cacheinstance.com.ibm.wps.ac.OwnedResourcesCache.enabled | FALSE | |
| cacheinstance.com.ibm.wps.ac.PermissionCollectionCache.lifetime | -1 | |
| cacheinstance.com.ibm.wps.ac.ProtectedResourceCache.lifetime | 14400 | |
| cacheinstance.com.ibm.wps.datastore.services.Identification.SerializedOidString.cache.size | 5000 | |
| cacheinstance.com.ibm.wps.model.factory.UserSpecificModelCache.size | 6000 | This cache uses more memory per object than other caches. The value should be set based on the number of concurrent, logged in users. Larger values may require a larger JVM heap size. A value of 6,000 was used to support 6,000 virtual users in the benchmark measurements. Increasing to 7,000 in other measurements increased throughput but required a heap size of 4,608 MB. |
| cacheinstance.com.ibm.wps.pe.portletentity.lifetime | 28800 | |
| cacheinstance.com.ibm.wps.pe.portletentity.size | 45000 | Monitor this cache and reduce size if not heavily used |
| cacheinstance.com.ibm.wps.policy.services.PolicyCacheManager.lifetime | 43200 | |
| cacheinstance.com.ibm.wps.puma.CommonPrincipalCache.size | 30000 | |
| cacheinstance.com.ibm.wps.puma.DN_OID_Cache.size | 30000 | Higher values can get a better hit ratio but not increase throughput |
| cacheinstance.com.ibm.wps.puma.OID_DN_Cache.size | 5000 | |
| cacheinstance.com.ibm.wps.resolver.data.cache.DataSourceCache.size | 8000 | |
| cacheinstance.com.ibm.wps.resolver.data.cache.FirstLevelDataSourceCache.size | 2003 | |
| cacheinstance.com.ibm.wps.services.vpmapping.HostnameToVirtualPortalIDCache.lifetime | -1 | |
| cacheinstance.com.ibm.wps.spa.parser.locale.FirstLevelLocalizationParserCache.size | 1009 | |
| cacheinstance.com.ibm.wps.spa.parser.skin.FirstLevelSkinParserCache.size | 1009 | |
| cacheinstance.com.ibm.wps.spa.parser.theme.FirstLevelThemeParserCache.size | 2003 | |
| cacheinstance.com.lotus.cs.services.UserEnvironment.size | 4500 | Tune this if live names support is used |
| cacheinstance.DigestCache.cache.size | 45000 | |
Reduce the Size of unused caches
To cut down on Portal memory usage, for unused or lightly used caches which are over 5000 entries, IBM recommends cutting their size in half. To determine if caches are unused, monitor the caches when portal is running a representative workload mix under a high load. The caches that are unused under those circumstances can be safely reduced in size.
Cache sizes
When changing the size of a cache, using a prime number as the size may give slightly better results. This has been verified for first level caches.
Disable Search
If search is not being used, it can be disabled to improve performance...In the WebSphere Portal Administration Page...
-
Search Administration | Manage Search | Search Collections | Delete all collections
These include the JCR collection and the “Default Search Collection”. These search collections do not include the WCM Authoring search indexer.
Disable personalization visibility rules
A large performance gain can be achieved by disabling the processing of personalization rules for pages and portlets.
-
./ConfigEngine.sh action-disable-pzntrans
To reenable...
-
ConfigEngine action-enable-pzntrans
Disable PZN Preprocessor
We are not using personalization rules, so we turn off the PZN preprocessor.
Edit...
-
profile_home/PortalServer/config/config/services/PersonalizationService.properties
...and set...
-
rulesEngine.preprocessor.enabled = false
Federated LDAP
Throughput can be improved by disabling nested group caches.-
./wsadmin.sh
wsadmin>$AdminTask configureAdminWIMUserRegistry {-customProperties {"com.ibm.ws.wim.registry.grouplevel=1"} }
wsadmin>$AdminConfig save
wsadmin>exit
DB2 server
Set the filesystem which will hold the Portal databases to be an Enhanced Journal File System (JFS2) because a large file system is limited to 64GB.
Turn on concurrent I/O (CIO) for Enhanced Journal File System as this improves performance.
-
mount -o cio /portaldb
Increase AIX maximum number of processes per user to 4096. The default 500 processes per user is too low for database server.
-
chdev -l sys0 -a maxuproc=’4096’
DB2 catalog statistics
Catalog statistics should be recomputed periodically...
-
db2 -x -r "runstats.db2" "select rtrim(concat('runstats on table ',concat(rtrim(tabSchema),concat('.',concat(rtrim(tabname),' on all columns with distribution on all columns and sampled detailed indexes all allow write access'))))) from syscat.tables where type='T'"
db2 -v -f "runstats.db2"
The first command creates file runstats.db2, which contains all of the runstats commands for all of the tables. The second command uses the file to run these commands. Run on each Portal database. Run on the JCR and release database data population after significant content population or changes.
To determine which tables might benefit from reorganization
-
db2 reorgchk current statistics on table all > "reorgchk.txt"
To reorganize a table based upon its primary key:
-
db2 reorg table tableschema.tablename
Set database parameter MaxAppls to be greater than the maximum JDBC pools size for all portal data sources.
Use System Managed Storage (SMS) for temporary table spaces. This saves time in buffer writes and improves disk utilization.
DB2 reorg
For each database, to improve performance...
-
db2 connect to dbName user db2wpadmin using password
db2 reorgchk update statistics on table all > xyz.out
Look in the reorg column for entries marked with a star or asterisk * in the file xyz.out.
For each line with *, note the tablename and run the following command for each tablename:
-
db2 reorg table tablename
After you have run the reorg command for each tablenames:
-
db2 terminate
db2rbind database_name -l db2rbind.out -u db2_admin -p password
The file db2rbind.out is created when there is an error.
DB2 buffer pools
DB2 9.7 supports automatic tuning of bufferpool sizes. IBM recommends enabling this setting on the JCR database.
For initial bufferpool size of JCR database...
-
db2 connect to <jcrdb>
db2 alter bufferpool icmlsfreqbp4 size 1000 automatic
db2 alter bufferpool icmlsvolatilebp4 size 16000 automatic
db2 alter bufferpool icmlsmainbp32 size 16000 automatic
db2 alter bufferpool cmbmain4 size 1000 automatic
db2 -v terminate
db2 connect reset
Other Portal database domains can use the default settings for DB2.
Fix out of memory errors in DB2
-
db2 connect to commdb
db2 get db cfg for commdb
db2 update db cfg for commdb using database_memory 125000 immediate
db2 connect to custdb
db2 update db cfg for custdb using dabase_memory 125000 immediate
db2 update db cfg for custdb using database_memory 125000 immediate
db2 connect to fdbkdb
db2 update db cfg for fdbkdb using database_memory 125000 immediate
db2 connect to lmdb
db2 update db cfg for lmdb using database_memory 125000 immediate
db2 connect to jcrdb
db2 update db cfg for jcrdb using database_memory 250000 immediate
db2 connect to reldb
db2 update db cfg for reldb using database_memory 125000 immediate
DB2 self tuning memory
IBM recommends enabling the DB2 9.7 self tuning memory feature of DB2 9.7. Recommended settings...
-
db2set DB2_RR_TO_RS=yes
db2set DB2_ASYNC_IO_MAXFILOP=512
db2 update dbm cfg using query_heap_sz 32768
db2 update dbm cfg using maxagents 500
db2 update dbm cfg using SHEAPTHRES 50000
db2 connect to jcrdb
db2 update db cfg for jcrdb using MAXFILOP 512
db2 update db cfg for jcrd using num_iocleaners 11
db2 update db cfg for jcrd using num_ioservers 11
db2 update db cfg for jcrd using dbheap automatic
db2 update db cfg for jcrd using locklist automatic
db2 update db cfg for jcrd using maxappls automatic
db2 update db cfg for jcrd using stmtheap automatic
db2 alter bufferpool ibmdefaultbp size automatic
db2 alter bufferpool icmlsfreqbp4 size automatic
db2 alter bufferpool icmlsvolatilebp4 size automatic
db2 alter bufferpool icmlsmainbp32 size automatic
db2 alter bufferpool cmbmain4 size automatic
db2 connect reset
DFT_QUERYOPT
This parameter controls how much optimization to use when compiling queries. The default value in DB 9.7 is 5. However, the Portal Info Center recommends setting this value to 2 for the JCR database. Performance benchmarks see the best results with this value as well.
To set...
-
db2 "UPDATE DB CFG FOR
MAX_JOINS_IN_UNION
The DB2 registry variable MAX_JOINS_IN_UNION limits the number of joins the Query Rewrite component of DB2 is allowed to push down into a UNION operator. Some JCR queries result in a large number of unions with the default settings. Changing this setting limits the number of unions DB2 we use in a query, potentially reducing processing time. This setting should be changed when query preparation times are high on queries with multiple joins.
In general, the more complex the SQL statement and the more complex the database, the more possible ways there are for Query Rewrite to rewrite the query and the more possible query plans there are for DB2 to evaluate. Setting MAX_JOINS_IN_UNION in this case limits the number of possible query plans that DB2 considers, and hence the amount of processing that is done to prepare the query while still generating a good query plan.
Note that setting this value has no effect at query optimization level 1 (see previous section for query optimization). Performance benchmarks show the best performance with the default setting. No change was observed using a setting of 30. However, data population with deep content hierarchies may benefit from changing this parameter to a higher value.
To set...
-
db2set DB2_UNION_OPTIMIZATION="MAX_JOINS_IN_UNION=30"
To return to the default setting...
-
db2set DB2_UNION_OPTIMIZATION=
Transaction log
For large content population sizes, IBM recommends increasing the transaction log size as well manually size the sortheap. Using an automatic setting caused a problem where the DB2 STMM would decrease the size of the sortheap too drastically and cause poor performance on certain JCR queries. The following settings were appropriate for up to 1 million content items in their testing. IBM recommends monitoring sortheap during a peak workload and tuning appropriately.-
db2 update db cfg for
db2 update db cfg for
db2 update db cfg for
db2 update db cfg for
db2 update db cfg for
IBM Tivoli Directory Server tuning
For a portal data population of 100,000 users and 15,000 groups, IBM recommends the following settings...| ibm-slapdACLCacheSize | 25000 |
| ibm-slapdEntryCacheSize | 100000 |
| ibm-slapdFilterCacheSize | 1000 |
| ibm-slapdFilterCacheBypassLimit | 100 |
| ibm-slapdDbConnections | 15 |
| ibm-slapdGroupMembersCacheSize | 15000 |
| ibm-slapdGroupMembersCacheBypassLimit | 100 |
IHS Tuning
For ST initial tuning, in...
-
/opt/IBM/Portal/IHS/conf/httpd.conf
...we are setting...
| ThreadLimit | 1000 | |
| ServerLimit | 3 | This value should be set to MaxClients / ThreadsPerChild. |
| StartServers | 3 | |
| MaxClients | 3000 | |
| MinSpareThreads | 30 | |
| MaxSpareThreads | 3000 | Should be set to the same values as MaxClients. |
| ThreadsPerChild | 1000 | |
| MaxRequestsPerChild | 0 | |
| KeepAliveTimeout | 5 | This value is less than the think time we define in our load measurement scripts to ensure that testing is conservative - forcing virtual users to open new TCP connections for each new page view. In a live environment, it can be helpful to increase the KeepAliveTimeout. However, a higher timeout value can increase contention for HTTP server processes, so if we are running out of HTTP processes, decrease this value. |
| MaxKeepAliveRequests | 0 | Selecting 0 lets an unlimited number of requests calls to a single TCP connection. |
To increase MaxClients, either the ServerLimit or ThreadLimit or both must also be increased. Unix based HTTP servers cache information in each process. So, when increasing settings, raise the number of threads first before raising the number of processes. This reduces the overall memory needed by the HTTP server.
The values used in the performance benchmarks are set to ensure there are sufficient resources to handle hundreds of hits per second from thousands of users. For smaller environments, lower values which use less server resources can be used. For example, to serve several hundred hits per second, ServerLimit could be set to 5, ThreadLimit could be set to 160 and MaxClients could be set to 800.
To monitor the number of running, and available Web server processes, enable the server-status module.
The web server must allow for sufficient concurrent requests to make full use of the application server infrastructure. The web server also acts as a filter and keeps users waiting in the network to avoid flooding the servers if more requests than the system can handle are incoming.
To set MaxClients...
-
MaxClients = (((TH + MC) * WAS) * 1.26) / WEB
...where for TEST env...
| TH | Number of threads (requests) in the web container. | Determine with server-status |
| MC | MaxConnections setting in the plugin-cfg.xml. | Currently set to -1 (no limit to pending connections) |
| WAS | Number of WAS servers | 2 |
| WEB | Number of Web servers | 2 |
MaxClients is currently set to 600.
ThreadLimit         25
ServerLimit         64
StartServers         1
MaxClients         600
MinSpareThreads     25
MaxSpareThreads     75
ThreadsPerChild     25
MaxRequestsPerChild  0
Enable disk caching (mod_disk_cache) in IHS
Recommendation: Choose mod_disk_cache over mod_mem_cache. To render a Portal page, especially in later version of Portal, requires a lot of "statics". These statics are images, CSS files, JavaScript files, etc. A lot of these statics are delivered on the same URL regardless of your security rights.Given that CPU cycles are considered "expensive" on the Portal/WAS servers and cheaper on the IHS/Apache servers, it is very desirable to reverse proxy these statics on the IHS servers using the mod_cache facilities.
Prior to IHS version 7, the only choice available was the "mod_mem_cache" module. Mod_mem_cache provides an RFC2616 compliant reverse proxy cache. IHS version 7 added support for the "mod_disk_cache" option in addition to the mem_cache.
Choosing the best type of cache neither intuitive nor obvious. The Apache Caching guide provides some guidance.
- mod_mem_cache:
- Cache is "Per process": Apache spawns processes to handle inbound HTTP(S) requests.
An instance of the mem_cache is created for each process. There is duplication of cache entries in this scenario (i.e. wasted CPU memory).
- Cache size limitations: Because of "1", the cache instances must necessary be limited in size to not exhaust CPU main memory.
There are several mod_mem_cache directives to help in limiting the size of responses that can be stored in the cache.
- Occasional inefficient replacement algorithm: Because of "1" and "2" together, responses that are near the limit of the size allowed in the cache, make force removal of responses better left in the cache.
- Limited capability for stale pages: Because the cache is limited in size and because it gets regenerated with each new process instantiation, there is very limited chance of stale responses being in the cache.
- Cache is "Per process": Apache spawns processes to handle inbound HTTP(S) requests.
- mod_disk_cache
- Cached responses are shared among all process: There is on instance of the cache system wide. Therefore, there is less wasted space in memory.
- Disk_cache type takes advantage of Unix/Linux file buffering:
- Need to use clean up utility - htcacheclean: mod_disk_cache does not automatically clean stale items in the cache.
This can result in wasted disk space. More troubling is that some responses from the response owner (i.e. Portal/WAS) may not have proper cache-control headers indicating how long responses are allowed to live in proxy caches. Therefore, the cache can potentially return the wrong, stale version of a response. The htcleancache utility is therefore needed to be periodically used (via "cron", for example), to insure stale responses are removed from the cache.
- Need to allocate disk space: Since the responses are stored on disk, there is always the potential to exhaust disk space.
When first considering which type caching to use, most would immediately suggest mem_cache as the better option. From a performance perspective, serving from memory is obviously better than serving from a disk. In reality though, because of how Unix/Linux buffer file I/O works, the benefits of disk_cache become apparent. Unix allocates unused portions of memory to buffer files as they are read. So, the initial read request starts reading the file into memory. Subsequent read requests for the same file are read from memory without even touching the disk. So, with the exception of the initial load, disk_cache performs as well as mem_cache and there is only one instance of the response in memory as opposed to "per process" duplication of mem_cache. Because memory utilization is more efficient, cache hit ratios can be much higher with disk_cache.
See: Some Tuning Tips For Apache Mod_Cache (mod_disk_cache)
Enable in-memory (mod_mem_cache) caching in IHS
If we use mod_cache, edit httpd.conf and set...
LoadModule cache_module modules/mod_cache.so
<IfModule mod_cache.c>
    LoadModule mem_cache_module modules/mod_mem_cache.so
        <IfModule mod_mem_cache.c>
        CacheEnable mem /
        CacheIgnoreHeaders Set-Cookie
        MCacheSize 102400
        MCacheMaxObjectCount 10000
        MCacheMinObjectSize 1
        # Needed with themes before WP 7.0.0.2
        # MCacheMaxStreamingBuffer 6291456
    MCacheMaxObjectSize 6291456
    </IfModule>
</IfModule>
Add Cache Headers in IHS
The HTTP protocol allows the server to tell clients how long they can cache responses. When the client has the content in their cache, they do not need to request it again, saving the round-trip time to the server to retrieve the content.
This is done by adding Cache-Control headers to the content which to make cacheable. By default, WebSphere Portal 8 will include these headers for some of the static content it serves. It is possible to use mod_expires and mod_headers in IBM HTTP Server to add the same headers to images, JavaScript and other static content for which Portal does not add headers. See Web Server Tuning for WAB for an alternative way to specify these same directives that works for base portal and WAB.
Add the following to the httpd.conf file.
LoadModule expires_module modules/mod_expires.so
LoadModule headers_module modules/mod_headers.so
# avoid gzip bug in IE 6 (from http://www.contentwithstyle.co.uk/blog/147)
BrowserMatch ^Mozilla/4\.[0678] no-gzip
BrowserMatch \bMSIE\s7 !no-gzip !gzip-only-text/html
Base Portal Tuning
WebSphere Portal 8.0 Performance Tuning Guide 49
AllowEncodedSlashes On
ExpiresActive On
ExpiresByType text/plain "access plus 1 week"
ExpiresByType image/gif "access plus 1 week"
ExpiresByType image/jpg "access plus 1 week"
ExpiresByType image/jpeg "access plus 1 week"
ExpiresByType image/png "access plus 1 week"
ExpiresByType application/x-javascript "access plus 1 week"
ExpiresByType text/javascript "access plus 1 week"
ExpiresByType text/css "access plus 1 week"
ExpiresByType application/xml "access plus 1 week"
ExpiresByType application/vnd.mozilla.xul+xml "access plus 1 week"
ExpiresByType application/x-www-form-urlencoded "access plus 1 week"
ExpiresByType text/html "access plus 1 week"
ExpiresByType text/xml "access plus 1 week"
ExpiresByType application/atom+xml "access plus 1 week"

# note the following max-age=86400 is just an example.
# A lower value might be more appropriate for the site
# Also, note that with the next setting, all html will have the Cache-Control
# header added. Your site might need to be more selective.
# Make sure the LoadModule directives above have been issued.
# Alternatively we can have a check if module is loaded before invoking
# the following directives.
# That is not shown here because the intent is they should be loaded.

 <LocationMatch "\.(gif|jpeg|jpg|png|ico|jsp|css|js|swf|json|htm|html)$">
    header set Cache-Control "public,max-age=86400"
</LocationMatch>
 <LocationMatch "/mccenabler/js/com/ibm/mm/livetext/.*\.cfg">
    header set Cache-Control "public,max-age=86400"
</LocationMatch>
 <LocationMatch "/mccbuilder/widget-catalog/.*\.xml">
    header set Cache-Control "public,max-age=86400"
</LocationMatch>
 # added so apache server status won't be cached
<LocationMatch "/server-status">
    Header set Cache-Control "no-cache,max-age=0"
</LocationMatch>
Content Compression on the HTTP Server
IBM HTTP Server supports compression using the mod_deflate module. When enabled, the HTTP server checks the Accept-Encoding header sent by the browser to see if it can accept a compressed version of the content. If so, the HTTP server will compress the content before sending it to the browser.
IBM has observed an average of 65% network traffic reduction when deflate compression is enabled. However, the compression operation does not come for free as they also observed approximately a 10% processor utilization increase on the HTTP server.
In benchmarks, the best performance was seen when Portal gzipped the content once at startup and the HTTP server cached the compressed version of the content. However, this environment does not have a significant amount of other static content. In sites with a large number of static files, performance may be improved by compressing that content as well. This can be done dynamically by the HTTP server.
To enable gzip compression in IBM HTTP Server, add the following lines in httpd.conf:
# compress everything but images
LoadModule deflate_module modules/mod_deflate.so

# these next 3 are for outputting to a log and go along with a LogFormat not mentioned here.
# See http://publib.boulder.ibm.com/httpserv/manual70/mod/mod_deflate.html
DeflateFilterNote Input instream
DeflateFilterNote Output outstream
DeflateFilterNote Ratio ratio

# Insert filter SetOutputFilter DEFLATE
# Netscape 4.x has some problems...
BrowserMatch ^Mozilla/4 gzip-only-text/html
# Netscape 4.06-4.08 have some more problems BrowserMatch ^Mozilla/4\.0[678] no-gzip
# MSIE masquerades as Netscape, but it is fine
BrowserMatch \bMSIE !no-gzip !gzip-only-text/html
 # Do not compress images
SetEnvIfNoCase Request_URI \
\.(?:gif|jpe?g|png|exe)$ no-gzip dont-vary
WebSphere HTTP Plugin Tuning
Set following plugin parameters are set:
-
ConnectTimeout: 60 (default 5)
Network Tuning
Set the following network tuning parameters on all the AIX systems...
| tcp_sendspace | 131072 |
| tcp_recvspace | 131072 |
| udp_sendspace | 65536 |
| udp_recvspace | 655360 |
| somaxconn | 10000 |
| tcp_nodelayack | 1 |
| rfc1323 | 1 |
These parameters can be set using the no command or through smit. In smit, the path to the change these is
-
Performance & Resource Scheduling | Tuning Kernel & Network Parameters | Tuning Network Option Parameters | Change/Show Current Parameters
To make the changes permanent, also select “Save Current Parameters for Next Boot”.
These tuning settings - particularly the tcp_sendspace and tcp_recvspace values - will allocate a significant amount of memory for network buffers. These can cause a performance problem if the system has a limited amount of memory. In that case, it may make sense to reduce these values.
For more info, see...
WCM Object Cache
| Cache Name | Value Used |
|---|---|
| abspath | 8000 |
| abspathreverse | 8000 |
| processing | 10000 |
| session | 6000 |
| strategy | 8000 |
| summary | 4000 |
To set, in the WAS console...
-
Resources | Cache instances | Object cache instances
WCM Cache Manager Service
From the WAS console, go to...
-
Resources → Resource Environment → Resource Environment Providers → WP CacheManagerService → Custom properties
...and set...
| Parameter | Value Used |
|---|---|
| cacheinstance.com.ibm.wps.ac.CommonRolesCache.size | 50000 |
| cacheinstance.com.ibm.wps.ac.ProtectedResourceCache.size | 20000 |
| cacheinstance.com.ibm.wps.cp.models.ModelCache.CategoryModel.lifetime | 28800 |
| cacheinstance.com.ibm.wps.cp.models.ModelCache.ResourceModel.lifetime | 28800 |
| cacheinstance.com.ibm.wps.cp.models.ModelCache.ResourceModel.size | 2000 |
| cacheinstance.com.ibm.wps.cp.models.ModelCache.TagModel.lifetime | 28800 |
| cacheinstance.com.ibm.wps.cp.models.ModelCache.TagModel.size | 2000 |
| cacheinstance.com.ibm.wps.pe.portletentitycounter.size | 5000 |
| cacheinstance.com.ibm.wps.resolver.resource.AbstractRequestDispatcherFactory.size | 100 |
| cacheinstance.com.ibm.wps.ac.OwnedResourcesCache.enabled | true |
Access Control Data Management Service
By using the loadRolesParentBased algorithm in the authoring environment, IBM showed an approximate 70% improvement in capacity was seen in performance benchmarks. The loadRolesParentBased setting changes the loading algorithm for the ROLE_INST and LNK_USER_ROLE tables in the database. Instead of loading all assigned roles for a specific principal, only the currently requested access control data is loaded and cached. This is beneficial to a dynamic type of workload like authoring where there are many items being created and deleted that require cache updates. Be aware that this setting may increase database load since fewer items will be cached so be sure that your database server has spare capacity before setting.
To set, from the WAS console go to...
-
Resources | Resource Environment | Resource Environment Providers | WP AccessControlDataManagementService | Custom properties
...and set...
| accessControlDataManagement.acucIgnoreResourceTypes | null | value should be the string “null”, not blank |
| accessControlDataManagement.loadRolesParentBased | true | Use the loadRolesParentBased setting in WCM authoring environments only. |
Enable servlet and portlet caching
This is especially helpful when the Web Content Viewer portlet is displaying non-personalized content.To set...
- Enable servlet caching in the WAS console...
-
Servers | Server Types | WebSphere appservers | WebSphere_Portal | Web Container Settings | Web container | Enable servlet caching
- Enable portlet fragment caching in the WAS console...
-
Servers | Server Types | WebSphere appservers | WebSphere_Portal | Portlet Container Settings | Portlet container | Enable portlet fragment caching
- Restart the Portal Server
- Login to portal as an administrator and navigate to page containing the rendering portlet to enable portlet caching or select "Edit Layout" for the page in the "Manage Pages" Administration portlet.
- Select "Configure" or "Edit Shared Settings" from the dropdown in the upper part of the portlet. When set under Configure mode, the settings apply to all instances of this portlet. In Edit mode the settings only apply to that one instance.

Web Content Viewer Portlet Caching
Log in as a Portal Administrator and navigate to the “Manage Pages” portlet.
Edit Page properties for the following pages
- myco.PRD2.portal.shop
- myco.PRD2.portal.howitworks
- myco.PRD2.portal.support
- myco.PRD2.portal.support.faqs
- myco.PRD2.portal.support.contactus
- myco.PRD2.portal.support.phones
- myco.PRD2.portal.howitworks.reserve
- myco.PRD2.portal.howitworks.autorefill
...and select "Edit Shared Settings" from the dropdown in the upper part of the portlet.
Under Portlet Settings | Portlet Cache Options | Cache Scope: Select "Shared cache across users"
Under Portlet Settings | Portlet Cache Options | Cache Expiration: Select "Cache expires after this many seconds" and set 86400
My Connections
Solutions Console: Resources | Object pool managers | My HTTP Connection Pool Manager | Custom object pools | com.myco.portal.net.http.PoolableConnection | Custom Properties
closeOnReturn: true
connectionTimeout: 10000
timeout: 20000
Web Services Clients
Solutions Console: Services | Policy Sets | Application policy sets | MyCo SOAP Services Policy | HTTP transport
Read timeout: 30
Write timeout: 30
Connection timeout: 5
Enable Subscriber only
This should be applied to production servers only
To specify, go to...
-
Resources | Resource Environment | Resource Environment Providers | WCM WCMConfigService | Custom properties
...and set...
| deployment.subscriberOnly | true |
Monitor the WCM Content Viewer Portlet Cache
- Install the Cache Monitor
- Give an administrator account access to the application.
-
Applications | Application Types | WebSphere enterprise applications | Dynamic Cache Monitor | Security role to user/group mapping | administrator | Map Users | user account | "selected"
- Login to the Cache Monitor application.
-
http://myserver.com:port/cachemonitor
- Select the baseCache and click OK
- At this point any WCM Web Content Viewer JSR 286 portlet with caching enabled should add entries to this cache.
- To look at the contents of the cache, click on the Cache Content link on the left side menu.
In addition to viewing the contents of the cache, we can also use the Cache Monitor application to view cache statistics, invalidate individual cache entries, and compare cache content.
Analyze garbage collection
We analyze JVM garbage collection patterns using an IBM Support Assistant tool such as PMAT. We leave verboseGC enabled, even during production. The amount of log data is not large; however, it is invaluable in terms of the visibility that this log brings to heap utilization problems.Garbage collection normally consumes 5% to 20% of total execution time. The optimum average time between GCs is at least 5-6 times the average duration of a single garbage collection
Execute concurrency test
Verify the site is able to handle the required number of concurrent users. The testing done to test for throughput doubles for testing the concurrency.Similar to peak throughput expected, the business will have peak concurrency expected. There would also be business requirements of the site to maintain performance past peak concurrency expected, which we call the required business concurrency. Corresponding to the throughput breaking point, there would be a concurrency breaking point.
Execute throughput test
The preferred approach for stress testing a system is to stick to the realistic think time and gradually vary the number of virtual users so the throughput exceeds the expected peak throughput (TP), then reaches the throughput level corresponding to the maximum business capacity (TP), and, eventually, reaches the breaking point (Tx) after sustaining the maximum system capacity (TC).This approach will give you realistic test results that are easy to interpret. The increase in throughput will be accompanied by an increase in CPU consumption, eventually maximizing the CPU when maximum throughput is achieved (TM).
However, in case we are testing on a test environment that is not as powerful as your production environment and you find we are limited by your test hardware such we are not able to increase the number of virtual users to take the system to the breaking point (Tx), then an alternative would be to decrease the thinktime. Decreasing the think time in your test scenarios way past the expected think time is akin to increasing virtual users way past the expected value. We can even turn your think time down to zero to maximize the stress on the site for a given number of virtual users.
This approach also benefits if we need to maximize your CPU consumption and throughput very quickly, instead of having a long trial and error process. However, the trade-off for this approach is the lack of ready-to-use test results. You would need to scale the results that you get from this test methodology so that we can interpret the corresponding behavior on your production environment for more realistic scenarios.
Such a scaling activity would require running a few experimental test cases and interpreting the results to come up with a scaling factor. Most of the time, especially for small and medium sized customers, such a scaling may turn out to be a linear factor. Any such scaling would need to be repeated with any major change in your system hardware, software, application, data, or even scenarios.
Once the system has reached maximum throughput (TC), the response times of further client interactions may not be relied upon. In our testing we find that WebSphere Application Server scales to increase in workload extremely well. So, although WebSphere Application Server handles all the additional work given to an application under stress, the queuing-up of workload leads to longer response times. For example, as the number of virtual users keep increasing and there are no more CPU cycles to accommodate this additional workload, then each virtual user gets a smaller and smaller time share of the CPU, driving the response times higher.
These response times may be unacceptable for shoppers or users of the site.
So, although the above approach provides you with an easy mechanism to stress the system and to look for bottlenecks, it still leaves the question of observed response times unanswered.
Soak test
Reliability testing is done around expected peak capacity (P) and higher. Usually, the testing should be conducted close to required minimum business capacity (B) but not more than the maximum system capacity (C).
The key factors of reliability testing is the duration for which the test is run as well as the variable workload to mimic typical day-to-day activities on the site.
Reliability runs are usually run for days and can be half a day, one day, and so on, generally going up to seven days. A three-day reliability run is very common, since this is usually long enough to start showing symptoms of many performance problems, should they exist. A three-day test also gives you an opportunity to start it on a Friday, observe the test for a little while, then leave it running for the weekend, and then come back on Monday and observe the test in execution for another little while before it completes.
Execute stress test
For each test scenario executed:
- For peak workload expected and minimum business capacity required, the error rate must be less than the acceptable error margin, as defined by your business requirement. For example, the acceptable error margin may include page errors less than 0.1%, resulting in less than 1% failed scenarios.
- Concurrency, throughput targets should be met or exceeded for both peak workload expected as well as for minimum peak business capacity required.
- Response time targets should be met or beat for both peak workload expected as well as for minimum peak business capacity required.
- For excess capacity past minimum business capacity although response time is allowed to go past the maximum requirement, the acceptable error rate should still conform to your business requirements.
If any of these passing criterion are not met then it should be considered a defect. If error rate is the cause of the test case failure then the defective code needs investigation.
If overall low performance is a concern then we need to go through the iterative process of performance tuning and re-executing the test case
Appendix
nmon logging
Use the nmon data collection model to collect detailed status data about the operating system for further analysis.
This example collects nmon performance results 180 times with an interval of 60 seconds, writing results to file: hostname.
The -t parameter is used to focus our attention on the status of the top processes.
-
nmon -f -t -r hostname -s 60 -c 180
A result file named hostname_timeSeries.nmon will be generated in the current directory.
CPU01,T0002,62.6,5.5,15.8,16.1
CPU02,T0002,60.6,6.9,16.1,16.3
CPU_ALL,T0002,61.6,6.2,16.0,16.2,,2
CPU00,T0002,61.6,6.2,16.0,16.2
MEM,T0002,73.0,97.8,5234.5,500.5,7168.0,512.0
MEMNEW,T0002,13.3,7.3,6.4,73.0,5.9,17.0
MEMUSE,T0002,7.3,19.2,77.0,960,1088,0.0,77.0
PAGE,T0002,2369.3,80.2,72.2,0.0,0.0,0.0,0.0,0.0
PROC,T0002,2.86,1.77,2258,24013,455,108,11,10,14,59
FILE,T0002,0,937,4,1357820,246443,0,0,0
NET,T0002,342.7,0.0,472.6,0.0,
NETPACKET,T0002,887.7,0.6,852.0,0.6,
NETERROR,T0002,0.0,0.0,0.0,0.0,0.0,0.0,
IOADAPT,T0002,320.1,288.7,125.4,0.0,0.0,0.0
JFSFILE,T0002,16.4,49.9,79.9,66.8,3.7,6.1,5.5,21.6,8.5,3.7,3.8,43.9
JFSINODE,T0002,2.8,0.3,2.0,1.1,0.1,0.2,0.1,9.4,0.4,0.2,21.2,1.6
DISKBUSY,T0002,0.0,0.0,0.0,0.0,0.0
DISKREAD,T0002,320.1,0.0,0.0,0.0,0.0
DISKWRITE,T0002,288.7,0.0,0.0,0.0,0.0
DISKXFER,T0002,125.4,0.0,0.0,0.0,0.0
DISKBSIZE,T0002,4.9,0.0,0.0,0.0,0.0
TOP,0372916,T0002,19.29,19.17,0.12,1,6544,64,6480,987,0.357,7,db2sysc,Unclassified
TOP,0680066,T0002,18.81,18.76,0.05,1,6532,64,6468,469,0.356,3,db2sysc,Unclassified
TOP,0508142,T0002,18.15,18.09,0.06,1,10004,64,9944,1286,0.545,6,db2sysc,Unclassified
After collecting data, download output file and load into your nmon-enabled Xcel spreadsheet.
Memory and paging
Use vmstat to monitor memory and paging. If "pi" or "po" columns are above zero, paging is occuring.
-
vmstat 10 360 > /tmp/vmstat.txt 2>1 &
Sample output:
 System configuration: lcpu=8 mem=6144MB ent=1.50
 kthr    memory              page              faults              cpu
----- ----------- ------------------------ ------------ -----------------------
 r  b   avm   fre  re  pi  po  fr   sr  cy  in   sy  cs us sy id wa    pc    ec
 2  1 1106326 221089   0   0   0  91  168   0  58 4288 2377  0  0 99  0  0.01   0.7
Think time
Think time is a delay in the processing of an HTTP request to reproduce the time that a human would take to read or examine the data displayed from a previous user action. Think time is calculated from the time that a request is received (that is, the display is complete on the monitor) until the time the user clicks a key or link to perform an action. We can increase, decrease, or randomize think time in tests or play it back exactly as recorded.
Saturation
Number of active virtual users at which point adding more virtual users does not result in an increase in the number of page views (PVs) .
To effectively drive a system to saturation, add Vusers a few at a time, let the system stabilize, observe whether PVs increase, and add more Vusers as possible. ("Stabilize," in this context, means the response times are steady within a window of several minutes.) On LoadRunner, if you plot Vusers against throughput (PVs), the PVs initially rises linearly with the number of Vusers, then reaches a maximum and actually decreases slightly from that point. The saturation point is the number of Vusers at which the PVs is at maximum.
At saturation, to determine the cause, take a Java thread dump (kill -3) against the portal Java process under test. Look for threads that are blocked or in a wait state.
Monitor JVM logs
Unchecked exceptions slow down JVM down and causes serial I/O to the SystemOut.log print stream, serializing the WAS transport threads.Results on systems with flaws are considered non-repeatable.
WebSphere Portal should not be allowed to enter a high-load production environment with any errors in the logs.
Get AIX statistics using nmon
Use the nmon data collection model to collect detailed status data about the operating system for further analysis.
This example collects nmon performance results 180 times with an interval of 60 seconds, writing results to file: hostname.
The t parameter is used to focus our attention on the status of the top processes.
nmon -f -t -r hostname -s 60 -c 180
A result file named hostname_timeSeries.nmon will be generated in the current directory. This file can be imported into MS Excel
CPU01,T0002,62.6,5.5,15.8,16.1
CPU02,T0002,60.6,6.9,16.1,16.3
CPU_ALL,T0002,61.6,6.2,16.0,16.2,,2
CPU00,T0002,61.6,6.2,16.0,16.2
MEM,T0002,73.0,97.8,5234.5,500.5,7168.0,512.0
MEMNEW,T0002,13.3,7.3,6.4,73.0,5.9,17.0
MEMUSE,T0002,7.3,19.2,77.0,960,1088,0.0,77.0
PAGE,T0002,2369.3,80.2,72.2,0.0,0.0,0.0,0.0,0.0
PROC,T0002,2.86,1.77,2258,24013,455,108,11,10,14,59
FILE,T0002,0,937,4,1357820,246443,0,0,0
NET,T0002,342.7,0.0,472.6,0.0,
NETPACKET,T0002,887.7,0.6,852.0,0.6,
NETERROR,T0002,0.0,0.0,0.0,0.0,0.0,0.0,
IOADAPT,T0002,320.1,288.7,125.4,0.0,0.0,0.0
JFSFILE,T0002,16.4,49.9,79.9,66.8,3.7,6.1,5.5,21.6,8.5,3.7,3.8,43.9
JFSINODE,T0002,2.8,0.3,2.0,1.1,0.1,0.2,0.1,9.4,0.4,0.2,21.2,1.6
DISKBUSY,T0002,0.0,0.0,0.0,0.0,0.0
DISKREAD,T0002,320.1,0.0,0.0,0.0,0.0
DISKWRITE,T0002,288.7,0.0,0.0,0.0,0.0
DISKXFER,T0002,125.4,0.0,0.0,0.0,0.0
DISKBSIZE,T0002,4.9,0.0,0.0,0.0,0.0
TOP,0372916,T0002,19.29,19.17,0.12,1,6544,64,6480,987,0.357,7,db2sysc,Unclassified
TOP,0680066,T0002,18.81,18.76,0.05,1,6532,64,6468,469,0.356,3,db2sysc,Unclassified
TOP,0508142,T0002,18.15,18.09,0.06,1,10004,64,9944,1286,0.545,6,db2sysc,Unclassified
iostat
The iostat command is used for monitoring system input/output device loading by observing the time the physical disks are active in relation to their average transfer rates. The iostat command generates reports used to change the system configuration to better balance the input/output load between physical disks and adapters. All statistics are reported each time the iostat command is run. The report consists of a tty and CPU header row followed by a row of tty or asynchronous I/O and CPU statistics. On multiprocessor systems, CPU statistics are calculated system-wide as averages among all processors. The iostat command generates four types of reports: the tty and CPU Utilization report, the Disk Utilization report, the System throughput report, and the Adapter throughput report.
We can set the interval and count for this command. The interval parameter specifies the amount of time in seconds between each report. If the interval parameter is not specified, the iostat command generates a single report containing statistics for the time since system startup (boot). The count parameter can be specified in conjunction with the interval parameter.
-
nohup iostat 15 240 > /tmp/iostat.txt &
If high I/O with low CPU, disk is bottleneck
svmon
svmon captures and analyze a snapshot of virtual memory. The displayed information does not constitute a true snapshot of memory, because the svmon command runs at the user level with interrupts enabled. The segment a set of pages and is the basic object used to report the memory consumption. Statistics reported by svmon are expressed in terms of pages. A page is a block of virtual memory, while a frame is a block of real memory. Frames always have a size of 4 KB, whereas pages may have different sizes. The base page size is 4 KB. All pages inside a segment have the same size.
| inuse counter | Used frames. |
| free counter | Free frames from all memory pools. |
| pin counter | Pinned frames (that is, frames that cannot be swapped). |
| virtual counter | Pages allocated in the system virtual space. |
| paging space counter | Pages reserved or used on paging spaces. |
TCP_TIMEWAIT
Time that must elapse before TCP/IP can release a closed connection and reuse its resources (TIME_WAIT state). During this time, reopening the connection to the client and server costs less than establishing a new connection.
Reduce if a low throughput occurs due to many connections sitting in the TIME_WAIT state
Use "no -a" to determine current value.
To set TCP_TIMEWAIT state to 15 seconds:
-
/usr/sbin/no -o tcp_timewait =1
The value (1) is in 15 second increments. For example, 1 equates to 15 seconds, 2 equates to 30 seconds, and so on. IBM recommends that set the value to 1 or 2.
Monitor LDAP
If several threads are in the Socket.read() method of the JNDI classes, they are likely waiting on results from the LDAP directory.
Tune dynamic cache with the cache monitor
Use this task to interpret cache monitor statistics to improve the performance of the dynamic cache service.
Verify that dynamic cache is enabled and the cache monitor application is installed on the appserver.
Use the cache monitor to watch cache hits versus misses. By comparing these two values, we can determine how much dynamic cache is helping the application, and if we can take any additional steps to further improve performance and decrease the cost of processing for the appserver.
- Start cache monitor and click on Cache Statistics.
Cache statistic Description Cache Size Maximum number of entries the cache can hold. Used Entries Number of cache entries used. Cache Hits Number of request responses served from the cache. Cache Misses Number of request responses that are cacheable but cannot be served from the cache. LRU Evictions Number of cache entries removed to make room for new cache entries. Explicit Removals Number of cache entries removed or invalidated from the cache based on cache policies or were deleted from the cache through the cache monitor. - We can also view the following cache configuration values:
Cache configuration value Description Default priority Default priority for all cache entries. Lower priority entries are moved from the cache before higher priority entries when the cache is full. We can specify the priority for individual cache entries in the cache policy. Servlet Caching Enabled If servlet caching is enabled, results from servlets and JSPs files are cached. Disk Offload Enabled Specifies if entries that are being removed from the cache are saved to disk. - Wait for the appserver to add data to the cache.
You want the number of used cache entries in the cache monitor to be as high as it can go. When the number of used entries is at its highest, the cache can serve responses to as many requests as possible.
- When the cache has a high number of used entries, reset the statistics. Watch the number of cache hits versus cache misses. If the number of hits is far greater than the number of misses, the cache configuration is optimal. You do not need to take any further actions. If we find a higher number of misses with a lower number of hits, the appserver is working hard to generate responses instead of serving the request using a cached value. The appserver might be making database queries, or running logic to respond to the requests.
- If we have a large number of cache misses, increase the number of cache hits by improving the probability that a request can be served from the cache.
To improve the number of cache hits, we can increase the cache size or configure additional cache policies.
If the free space after GC declines with no growing AF, then most likely cache tuning is causing the memory problems. Caching does not necessarily mean DynaCache. It includes other types of cache that are being used. One solution is reducing the in-memory cache size and letting the overflow entries use the disk cache if possible.
IBM recommends having 40% of JVM free after caching is enabled.
Sometimes an excessive number of cache objects look like a memory leak since the cache grows as the application receives an increasing load. Customers and testers need to find a stabilization point where the system does not generate OutOfMemory errors due to too many cached objects. Tune the cache size according to how much heap size is being used. In Figure 24-13, the example shows an OutOfMemory exception. After further examination, you see the cached page is 60-100 KB in size and the number of cache entries is set to 5000. Therefore, half of this 1 GB heap is allocated to the cache.

Note: A quick way to rule out caching, such a Dynamic Caching, concerns that may work for you is to try turning-off Dynamic Caching altogether, to force disk caching, or to keep all cached objects in memory. The behavior of your application under such circumstances may reveal whether caching policies or disk offload may be contributing to your caching concerns.
Note, however, that this trial-and-error approach may change your application's error path and thus deviate from the error-causing scenarios.
In most cases, we can adjust the DynaCache size to eliminate such problems.
To tune the DynaCache size:
- Log in to the WAS administrative console.
- Expand...
Servers | Application servers | server1 | Container Services | Dynamic Cache Service | Cache size
- Set the value of the cache size that we want.
- Save your changes and restart the application server.

Web Server Plug-In Analyzer
IBM Web Server Plug-in Analyzer for WebSphere Application Server helps discover potential problems with trace and configuration files during use of WebSphere Application Server. The tool parses both plug-in configuration and corresponding trace files and then applies pattern recognition algorithms in order to alert users of possible inconsistencies.
The tool provides a list of HTTP return codes, URI and graphical presentations of available clusters, and server topologies from the configuration and trace files.
Primary capabilities...
- Detection of incorrect or potentially problematic configurations that could cause service interruption or performance degradation
- identification of request failure or response failure
- HTTP return code tracking
- URI failure tracking
- graphical presentation of WebSphere Application Server and cluster topology
- cluster and cluster member tracking.
The package includes the stand-alone code, documentation, and license files.
How does it work?
The tool parses WebSphere Application Server plug-in configuration files and trace files. Based on results obtained from a pattern recognition engine, IBM Web Server Plug-in Analyzer provides information about any potential problems within the configuration.
The pattern recognition engine maintains various patterns of configurations that are not usually recommended and provides warnings if these same patterns are detected in the configuration files.
The tool takes the following approach:
- Parses configuration files.
- Provide warnings or clues to information when configurations appear to be set inappropriately.
- Collects WebSphere Application Server cluster and member topology information within the configuration file.
- Displays a visual mapping of the cluster and member topology.
- Parses the plug-in trace files and creating models based on HTTP request/response header/body information, HTTP return code, URI, start/end time, cluster name, and server name.
- Displays the requested trace information based on query. The trace information has HTTP return code analysis and HTTP request/response header/body analysis.
Monitor plug-in maximum number of connections
All requests to the appservers flow through the HTTP Server plug-in. The application server selection logic in the plug-in has been enhanced so that it takes into account the number of pending connections to the application server. The maximum number of connections attribute is used to specify the maximum number of pending connections to an application server that can be flowing through a Web server process at any point in time.
Each application server can have a maximum number of pending connections coming from Web server plug-ins.
To change this setting, go to...
-
Servers | Application servers | AppServer_Name | Web server plug-in properties
The default setting is No Limit, which is the same as though the value is set to -1 or zero. The attribute can be set to any arbitrary value. For example, let the two appservers be fronted by two nodes running IBM HTTP Server. If the MaxConnections attribute is set to 10, then each application server could potentially get up to 20 pending connections.
If the number of pending connections reaches the maximum limit of the application server, then it is not selected to handle the current request. If no other application server is available to serve the request, HTTP response code 503 (service unavailable) is returned to the user.
To monitor the behavior of the plug-in when a cluster member has too many requests, use a load testing tool (such as ApacheBench or JMeter), the plug-in log, the HTTP servers' access log, and Tivoli Performance Viewer.
For our test we have configured wasmember05 to have a maximum connection setting of 3 and wasmember06 of 4. We have one HTTP server fronting the appservers. Running a load test with 30 concurrent users against this cluster eventually results in both members having reached the maximum connections value. At this point, the user gets Error 503.
-
...
[Wed May 11 07:26:23 2005] 00007ab5 aaff9bb0 - P1ATS: ws_server_group: serverGroupCheckServerStatus: Checking status of wasna01_wasmember05, ignoreWeights 0, markedDown 0, retryNow 0, wlbAllows 17 reachedMaxConnectionsLimit 1
[Wed May 11 07:26:23 2005] 00007ab5 aaff9bb0 - WARNING: ws_server_group: serverGroupCheckServerStatus: Server wasna01_wasmember05 has reached maximmum connections and is not selected
[Wed May 11 07:26:23 2005] 00007ab5 aaff9bb0 - P1ATS: ws_server_group: serverGroupCheckServerStatus: Checking status of wasna02_wasmember06, ignoreWeights 0, markedDown 0, retryNow 0, wlbAllows 14 reachedMaxConnectionsLimit 1
[Wed May 11 07:26:23 2005] 00007ab5 aaff9bb0 - WARNING: ws_server_group: serverGroupCheckServerStatus: Server wasna02_wasmember06 has reached maximmum connections and is not selected
[Wed May 11 07:26:23 2005] 00007ab5 aaff9bb0 - ERROR: ws_server_group: serverGroupNextRoundRobinServer: Failed to find a server; all could be down or have reached the maximimum connections limit
[Wed May 11 07:26:23 2005] 00007ab5 aaff9bb0 - WARNING: ws_common: websphereFindServer: Application servers have reached maximum connection limit
[Wed May 11 07:26:23 2005] 00007ab5 aaff9bb0 - ERROR: ws_common: websphereWriteRequestReadResponse: Failed to find a server
[Wed May 11 07:26:23 2005] 00007ab5 aaff9bb0 - ERROR: ESI: getResponse: failed to get response: rc = 8
[Wed May 11 07:26:23 2005] 00007ab5 aaff9bb0 - ERROR: ws_common: websphereHandleRequest: Failed to handle request
When the plug-in detects there are no appservers available to satisfy the request, HTTP response code 503 (service unavailable) is returned. This response code appears in the Web server access log...
-
[11/May/2005:07:26:23 -0500] "GET /wlm/BeenThere HTTP/1.1" 503 431
[11/May/2005:07:26:23 -0500] "GET /wlm/BeenThere HTTP/1.1" 503 431
Further down in the plug-in log we can see that eventually both servers respond to requests again when they have reduced their backlog.
-
...
#### wasmember05 worked off the pending requests and is "back in business", wasmember06 is still in "reachedMaxConnectionsLimit" status:
[Wed May 11 07:26:23 2005] 00007ab9 b640bbb0 - P1ATS: ws_server: serverSetFailoverStatus: Server wasna01_wasmember05 : pendingConnections 0 failedConnections 0 affinityConnections 0 totalConnections 1.
[Wed May 11 07:26:23 2005] 00007ab9 aa5f8bb0 - P1ATS: ws_server_group: serverGroupCheckServerStatus: Checking status of wasna01_wasmember05, ignoreWeights 0, markedDown 0, retryNow 0, wlbAllows 17 reachedMaxConnectionsLimit 0
[Wed May 11 07:26:23 2005] 00007ab9 aa5f8bb0 - P1ATS: ws_server: serverSetFailoverStatus: Server wasna01_wasmember05 : pendingConnections 0 failedConnections 0 affinityConnections 0 totalConnections 2.
[Wed May 11 07:26:23 2005] 00007ab9 a9bf7bb0 - P1ATS: ws_server_group: serverGroupCheckServerStatus: Checking status of wasna02_wasmember06, ignoreWeights 0, markedDown 0, retryNow 0, wlbAllows 14 reachedMaxConnectionsLimit 1
[Wed May 11 07:26:23 2005] 00007ab9 a9bf7bb0 - WARNING: ws_server_group: serverGroupCheckServerStatus: Server wasna02_wasmember06 has reached maximmum connections and is not selected
...
#### wasmember06 is working off the the requests. Once it reduced the number of pending connections to below 4 (which is the maximum) it can then also serve requests again. Both servers are handling user requests now:
...
[Wed May 11 07:26:23 2005] 00007ab5 b4608bb0 - P1ATS: ws_server: serverSetFailoverStatus: Server wasna02_wasmember06 : pendingConnections 3 failedConnections 0 affinityConnections 0 totalConnections 4.
[Wed May 11 07:26:23 2005] 00007ab9 b5009bb0 - P1ATS: ws_server: serverSetFailoverStatus: Server wasna02_wasmember06 : pendingConnections 2 failedConnections 0 affinityConnections 0 totalConnections 4.
[Wed May 11 07:26:23 2005] 00007ab9 b3c07bb0 - P1ATS: ws_server: serverSetFailoverStatus: Server wasna02_wasmember06 : pendingConnections 1 failedConnections 0 affinityConnections 0 totalConnections 4.
[Wed May 11 07:26:23 2005] 00007ab9 b5a0abb0 - P1ATS: ws_server: serverSetFailoverStatus: Server wasna02_wasmember06 : pendingConnections 0 failedConnections 0 affinityConnections 0 totalConnections 4.
[Wed May 11 07:26:24 2005] 00007ab9 b3206bb0 - P1ATS: ws_server_group: serverGroupCheckServerStatus: Checking status of wasna02_wasmember06, ignoreWeights 0, markedDown 0, retryNow 0, wlbAllows 14 reachedMaxConnectionsLimit 0
This feature helps you to better load balance the appservers fronted by the plug-in. If appservers are overloaded, the plug-in skips these appservers automatically and tries the next available application server.
However, a better solution is to have an environment that can handle the load we are expecting and to have it configured correctly. This includes setting weights that correspond to the system capabilities, having the correct balance of cluster members and Web servers, and setting up the queues for requests and connections.
Memory leaks
In a normal Free Space after GC graph, where the application is using the Java heap properly, the red line should be approximately on a horizontal line.
With a memory you get a declining red line. The free space available to allocate is decreasing. If we suspect a memory problem, continue running the test until an OutOfMemory exception occurs because some downward trends in free space will stabilize after a period of time. This helps you to get better support from WebSphere Application Server and the JDK if the problem is related to or the JDK.
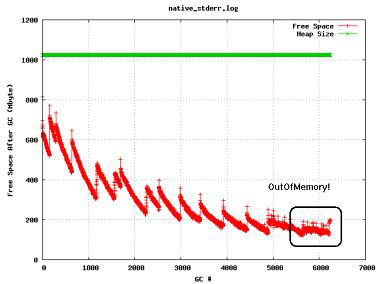
Look for database contention
If the thread dumps (kill -3) indicate threads waiting in JDBC classes in Socket.read() methods, then there are likely response time issues in the database itself.
At initial database transfer time, Portal sets up the databases with indexes that should be good initial starting points. The DBA should monitor the database and effect changes to remove bottlenecks in the system.
Common problems...
- Queries taking excessive time due to table scans
- Insufficient processor and memory resources on the DB server itself
- Insufficient allowed connections as opposed to the configured JDBC pool sizes on Portal and WCM
When thread dumps indicate excessive JDBC wait times, take snapshots for long queries. Generally, Portal and WCM queries all execute in subseconds, if not in milliseconds. Look at the execution plans for long-running queries, and see if additional indexes might be required to improve response times on problematic queries.
When threads are waiting on JDBC pool resources in WAS, you see the threads in a condition wait (CW) state in the WAS connection pool (J2C) classes. In this case, we might need to increase the pool size for this data source. Note that in doing so, we might need to increase the number of connections the database server can handle concurrently.
Appendix: Enable server-status
The IBM HTTP Server server-status page is available on all supported IHS platforms. It shows performance data on a Web page in HTML format.
To activate the server-status page, edit httpd.conf and remove the comment character (#) from the following lines:
#LoadModule status_module modules/mod_status.so
#<Location /server-status>
#    SetHandler server-status
#    Order deny,allow
#    Deny from all #    Allow from .myco.com
#</Location>
Save the changes and restart IHS.
Open the URL...
-
http://<webserver>/server-status
...and click Refresh to update the status.
If the browser supports refresh, we can also use the URL...
-
http://<webserver>/server-status?refresh=5
..to refresh every 5 seconds. We can see the number of requests currently being processed and the number of idle servers.
Appendix: Set cloneIds
The Workload Manager (WLM) in WebSphere does load balancing and can direct traffic to any available clone in a cluster or cell defined for the application. We can hit a clone directly through the WebSphere port defined for the WAS, but in most environments that is blocked by a firewall. To go around this block, use IHS rules that direct traffic to a clone based on URL query strings.The first thing to do is to identify the names for your clones. Use the name specified in the WAS administrative console. We also need to know the port from which the clone is served.

After you have this information, edit httpd.conf files with a new stanza. For this example, the keyword is cloneID, and the CloneNames are WebSphere_Portal and WebSphere_Portal_Clone_2 with ports 9085/9086. The target WebSphere Application Server hostname is host name.ibm.com.
<LocationMatch "cloneID$" >
RewriteEngine on
RewriteCond %{QUERY_P2,gRING} ^WebSphere_Portal_Clone_2
RewriteRule /(.*)/cloneID$ http://hostname.ibm.com:9086/$1 [P]
 RewriteCond %{QUERY_P2,gRING} ^WebSphere_Portal
RewriteRule /(.*)/cloneID$ http://hostname.ibm.com:9085/$1 [P]
</LocationMatch>
This stanza, after it is added to all your IHS servers, allows us to obtain session affinity with a specific clone. To use this stanza, for example, you access the portal application and append ?cloneID=WebSphere_Portal_Clone_2 to the URL, and your request is sent to WebSphere_Portal_Clone_2.
This method is useful in large-scale evironments where you have many clones and we need to debug or reproduce a problem, and you don't want to search through every clone on each server to find where your request went. It is also a great tool for finding issues that are clone-specific or when to measure performance times of components based on log timestamps.