PMI data organization
PMI provides server-side monitoring and a client-side API to retrieve performance data. PMI maintains statistical data within the entire WAS domain, including multiple nodes and servers. Each node can contain one or more appservers. Each appserver organizes PMI data into modules and submodules.
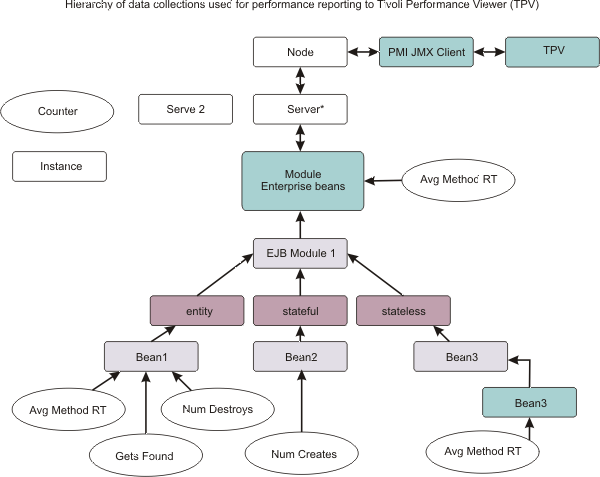
Tivoli Performance Viewer organizes performance data in a centralized hierarchy of the following objects:
| Node | Physical machine in the WAS admin domain. |
| Server | Functional unit that provides services to clients over a network. No performance data is collected for the server itself. |
| Module | Represents one of the resource categories for which collected data is reported to the performance viewer. Each module has at least one configuration file in XML format. These files determine organization and lists a unique identifier for each performance data in the module. Modules include...
|
| Submodule | Represents a fine granularity of a resource category under the module. For example, ORB thread pool is a submodule of the thread pool category. Submodules can contain other submodules. |
| Counter | Data type used to hold performance information for analysis. Each resource category (module) has an associated set of counters. The data points within a module are queried and distinguished by the MBean ObjectNames or PerfDescriptors. Examples of counters include the number of active enterprise beans, the time spent responding to a servlet request and the number of kilobytes of available memory. |
Tivoli Performance Viewer is a thin client, integrated into the WAS admin console, that provides a simple viewer for the performance data provided by PMI, allowing users to view and manipulate the data for counters.
A particular counter type can appear in several modules. For example, both the servlet and enterprise bean modules have a response time counter. In addition, a counter type can have multiple instances within a module. In the figure above, both the Enterprise beans module and Bean1 have an Avg Method RT counter.
Counters are enabled at the module level and can be enabled or disabled for elements within the module. For example, in the figure, if the enterprise beans module is enabled, its Avg Method RT counter is enabled by default. However, we can then disable the Avg Method RT counter even when the rest of the module counters are enabled. We can also, if desired, disable the Avg Method RT counter for Bean1, but the aggregate response time reported for the whole module no longer includes Bean1 data.
As part of a fine-grained control feature, WAS provides statistic sets which are pre-defined, fixed server-side sets, based on the PMI statistic usage scenarios. The PMI spec levels include:
none All PMI modules are disabled basic Basic level of monitoring. extended Basic level of monitoring plus Work Load Monitor, Performance Advisor, and Tivoli resource models. all Enables all statistics. custom Fine-grained control to enable or disable statistics individually.
There are only two states for a statistic:
- enabled
- disabled
For synchronized updates use synchronizedUpdate at the PMI service level. If true, all statistic updates are synchronized. Default is false. To enable, select checkbox for...
Use sequential counter updates
The synchronizedUpdate parameter is the equivalent to the Max level in V5.0.x and V5.1x.
Data collection can affect performance of the appserver. The impact depends on the number of counters enabled, the type of counters enabled and the monitoring level set for the counters.
The following PMI modules are available to provide statistical data:
- Enterprise bean module, enterprise bean, methods in a bean
- Data counters for this category report...
- load values
- response times
- life cycle activities
Including...
- average number of active beans
- number of times bean data is loaded or written to the database
Information is provided for enterprise bean methods and the remote interfaces used by an enterprise bean. Including...
- number of times a method is called
- average response time for methods
The TPV reports information on the size and use of a bean objects cache or enterprise bean object pool. Including...
- number of calls attempting to retrieve an object from a pool
- number of times an object is found available in the pool
- JDBC connection pools
- Data counters for this category contain usage information about the JDBC connection pools for a database. Including...
- number of managed connections or physical connections
- total number of connections or connection handles
- J2C connection pool
- Data counters for this category contain usage information about the J2EE Connector architecture that enables enterprise beans to connect and interact with procedural back-end systems, such as CICS, and IMS. Including...
- Number of managed connections or physical connections
- total number of connections or connection handles
- JVM API
- Data counters for this category contain memory used by a process as reported by JVM run time. Examples are...
- total memory available
- amount of free memory for the JVM
JVM run time also includes data from the JVMTI.
- Servlet session manager
- Includes...
- total number of accessed sessions
- average amount of time it takes for a session to perform a request
- average number of concurrently active HTTP sessions
- Thread pool
- Data counters for this category contain information about the thread pools for ORB threads and the Web container pools used to process HTTP requests. Including...
- number of threads created and destroyed
- maximum number of pooled threads allowed
- average number of active threads in the pool
- JTA
- Data counters for this category contain performance information for the transaction manager. Including...
- average number of active transactions
- average duration of transactions
- average number of methods per transaction
- Web apps, servlet
- Data counters for this category contain information for the selected server. Including...
- number of loaded servlets
- average response time for completed requests
- number of requests for the servlet
- Object Request Broker (ORB)
- Data counters for this category contain information for the ORB. Examples include the object reference lookup time, the total number of requests, and the processing time for each interceptor.
- Web services gateway (WSGW)
- Data counters for this category contain information for WSGW. Examples include the number of synchronous and asynchronous requests and responses.
- System data
- Data counters for this category contain information for a machine (node). Including...
- CPU utilization
- memory usage
Note that this category is available at the node level, which means it is only available for the node agent if we are running multiple servers.
- Workload Management (WLM)
- Data counters for this category contain information for workload management. Including...
- number of requests
- number of updates
- average response time
- Dynamic cache
- Data counters for this category contain information for the dynamic cache service. Including...
- in-memory cache size
- number of invalidations
- number of hits and misses
- Web services
- Data counters for this category contain information for the Web services. Including...
- number of loaded Web services
- number of requests delivered and processed
- request response time
- average size of requests
- Alarm manager
- Data counters for this category contain information for the Alarm Manager.
- Object pool
- Data counters for this category contain information for Object Pools.
- Scheduler
- Data counters for this category contain information for the Scheduler service.
We can access PMI data through the getStatsObject and the getStatsArray method in the PerfMBean. we need to pass the MBean ObjectName(s) to the PerfMBean.
Use the following MBean types to get PMI data in the related categories:
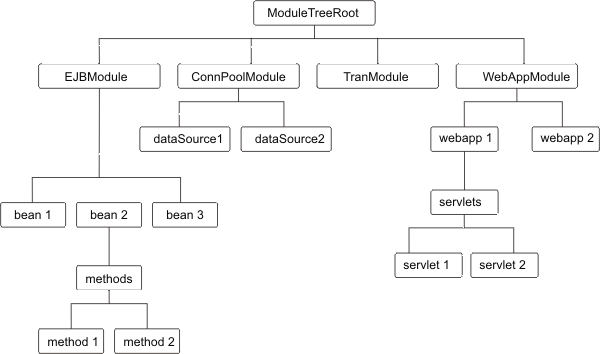
DynaCache dynamic cache PMI data EJBModule* EJB module PMI data (BeanModule) EntityBean* EJB PMI data (BeanModule) JDBCProvider* JDBC connection pool PMI data J2CResourceAdapter* Java 2 Connectivity (J2C) connection pool PMI data JVM Java virtual machine PMI data MessageDrivenBean* EJB PMI data (BeanModule) ORB Object Request Broker PMI data Server PMI data in the whole server, pass recursive=true to PerfMBean SessionManager* HTTP Sessions PMI data StatefulSessionBean* EJB PMI data (BeanModule) StatelessSessionBean* EJB PMI data (BeanModule) SystemMetrics system level PMI data ThreadPool* thread pool PMI data TransactionService JTA Transaction PMI data WebModule* Web app PMI data Servlet* servlet PMI data WLMAppServer Workload Management PMI data WebServicesService Web services PMI data WSGW* Web services gateway PMI data
To use the AdminClient API to query the MBean ObjectName for each MBean type. We can either query all the MBeans and then match the MBean type or use the query String for the type only:
String query = "WebSphere:type=mytype,node=mynode,server=myserver,*";
You get a Set value when you call the AdminClient class to query MBean ObjectNames. This response means that we can get multiple ObjectNames.
In the previous example, the MBean types with a star (*) mean that there can be multiple ObjectNames in a server for the same MBean type. In this case, the ObjectNames can be identified by both type and name (but mbeanIdentifier is the real UID for MBeans). However, the MBean names are not predefined. They are decided at run time based on the applications and resources. When you get multiple ObjectNames, we can construct an array of ObjectNames that we are interested in. Then we can pass the ObjectNames to PerfMBean to get PMI data. we have the recursive and non-recursive options. The recursive option returns Stats and sub-stats objects in a tree structure while the non-recursive option returns a Stats object for that MBean only.
Subtopics
Enterprise bean countersJDBC connection pool counters
J2C connection pool counters
Java virtual machine counters
Object Request Broker counters
Servlet session counters
Transaction counters
Thread pool counters
Web app counters
Workload Management counters
System counters
Dynamic cache counters
MBean cache statistics
Web services counters
Alarm Manager counters
Object Pool counters
Scheduler counters
High availability manager counters
Distribution and consistency services (DCS) stack counters
PortletContainer PMI counters
Extension registry counters
Proxy counters
Service integration bus counters
SIP PMI counters
IBM Tivoli Composite Application Manager for WAS counters
Related concepts
Develop your own monitoring applications.PMI
Related tasks
Monitor overall system healthEnable PMI
Related
Web services gateway countersPerformance Monitoring Infrastructure settings

