Measuring and improving business processes
Measuring and improving business processes
Monitor overall system performance of IBM Business Process Manager and its process applications. Refine process models for better performance, and configure and use key performance indicators to analyze process and task performance.
You can monitor many different aspects of IBM Business Process Manager, but the activities fall generally into either system monitoring or monitoring the applications and processes themselves, as described in this section.
Use IBM Business Monitor with process applications
If you have IBM Business Monitor installed, you can monitor processes running on the Process Center server or on a process server.
IBM Business Monitor overview
IBM Business Monitor is comprehensive business activity monitoring software that provides an up-to-date view of your business performance and also provides predictions so that you can take action before problems occur. Personalized business dashboards process business events and data, and calculate key performance indicators (KPIs) and metrics. IBM Business Monitor can collect events and data from a wide variety of sources.
To monitor IBM Business Process Manager V8.5, you use Business Monitor V8.0.1.
- Event flow IBM Business Process Manager emits monitoring events, which are sent to a Java™ Messaging Service (JMS) queue and then used by Business Monitor. The JMS queue and a corresponding JMS queue connection factory are created automatically during installation of Business Monitor. When BPM detects the presence of the JMS queue and the JMS queue connection factory, BPM begins to emit events while executing a process application that has been enabled for business monitoring.
- Versioning in monitor models You can have multiple versions of a monitor model for a process application and its snapshots, though only one version can be active at any given time. Data captured by older versions is still visible on the dashboard.
- Generated dashboards When a business BPD is run in the Inspector view or the process application snapshot is deployed, monitoring data is collected and sent to a custom dashboard available in Business Space.
Event flow
IBM Business Process Manager emits monitoring events, which are sent to a Java™ Messaging Service (JMS) queue and then used by Business Monitor. The JMS queue and a corresponding JMS queue connection factory are created automatically during installation of Business Monitor. When BPM detects the presence of the JMS queue and the JMS queue connection factory, BPM begins to emit events while executing a process application that has been enabled for business monitoring.
The flow of a monitoring event from BPM to Business Monitor is illustrated in the following diagram.

Default JMS queue in BPM
IBM Business Process Manager looks for a JMS queue and JMS queue connection factory with the following JNDI names:
- jms/com.ibm.lombardi/EventEmissionQueue
- jms/com.ibm.lombardi/EventEmissionQueueFactory
Events are emitted only when the JMS queue and connection factory are present and available to IBM Business Process Manager.
Default JMS queue configured as an input queue in Business Monitor
Business Monitor includes an application called IBM_BPM_EMITTER_SERVICE, which reads events from a JMS queue and submits them to Business Monitor. To ensure that events in the JMS queue can flow to Business Monitor, the following queue, queue connection factory, and activation specification must point to the same JMS queue (jms/com.ibm.lombardi/EventEmissionQueue) that is the destination for events emitted by IBM Business Process Manager:
- jms/com.ibm.lombardi/JMSEmitterInput
- jms/com.ibm.lombardi/JMSEmitterInputQueueFactory
- jms/com.ibm.lombardi/JMSEmitterInputActivationSpec
For more information about configuring the IBM_BPM_EMITTER_SERVICE, refer to the related topic "Configuring the environment using wsadmin commands."
Event flow configuration
Because IBM Business Process Manager V8.5 and Business Monitor V8.0.1 are deployed in separate cells, you set up the configuration so that events are emitted to the Common Event Infrastructure (CEI) event service that is already configured within the BPM Advanced cell. You then configure your Business Monitor model to receive the events that were emitted to the CEI event service by way of table-based event delivery. For more information about this advanced configuration, refer to the related topic "Configuring event flow to a remote server."
Disable event flow
You can prevent the server from emitting events. By default, events are emitted if any of the following conditions are true for the process application:
- The process application includes a custom monitor model.
- Auto-tracking is enabled for at least one business process definition in the process application.
- A business process definition includes one or more intermediate tracking events.
- The JMS queue named jms/com.ibm.lombardi/EventEmissionQueue exists.
To disable event emission for the server, update the 100Custom.xml configuration file, as described in the following steps:
- Locate 100Custom.xml in the following directory:
PROFILE_HOME\config\cells\cell_name\nodes\node_name\servers\server_name\profile-type\config
where profile-type is one of the following values:
- process-center
- process-server
- Copy the following configuration property and paste it into 100Custom.xml as a child of the <common> element:
<monitor-event-emission>
  <enabled merge="replace">false</enabled>
</monitor-event-emission>
If the <common> element is not already in the file, add it. The following is an example of the file:
<properties> <common merge="mergeChildren"> <monitor-event-emission> <enabled merge="replace">false</enabled> </monitor-event-emission> </common> </properties> - Restart the server so the changes will take effect.
Related tasks:
Configure event flow to a remote server
 Configure the environment using wsadmin commands
Configure table-based event delivery in a multiple-cell environment
Versioning in monitor models
You can have multiple versions of a monitor model for a process application and its snapshots, though only one version can be active at any given time. Data captured by older versions is still visible on the dashboard.
When a process is changed in a way that affects monitoring (for example, when custom tracking groups, timing intervals, or auto-tracked fields are added, modified, or deleted), generate a new version of the monitor model that captures those changes.
Versioning for custom monitor models is done at the discretion of the process application developer, who decides when a new version of the monitor model must be deployed. For custom monitor models created in IBM Integration Designer, the Integration Designer developer makes the changes to the monitor model and changes the model timestamp, as described in "Synchronizing and updating monitor models for process applications."
Monitor models are identified by an ID ( bmon_ORDPROC_MAIN) and a version timestamp ( 2011-01-01T12:00:00+0400). Models with different IDs are unrelated. Models that share the same ID and have different, increasing timestamps are related and are considered versioned.
Monitor models have one of the following Common Event Infrastructure (CEI) distribution modes:
- Active
- Active (no new MC instances)
- Inactive (event queue recoverable)
- Inactive
Only the most recent version of a monitor model can have a Common Event Infrastructure (CEI) distribution mode of Active.
When a new version of the model is deployed with a process application snapshot, older versions are quiesced and their CEI distribution mode is set to Active(no new MC instances). This means that events related to new monitoring context instances will go to the new version, while events relating to existing monitoring context instances will go to the old version.
In a situation where a process application is tracked by both a generated model and one or more custom monitor models, the latest version of each can be active. This is possible because the custom and generated monitor models have different IDs.
When you deploy a new version of the monitor model, a set of tables and views is created in the MONITOR database to support that version. Additionally, a set of cross-version views is created to support dashboard queries that require data across all the current and previous model versions. Data that did not exist in previous model versions results in null values being returned.
Versioning limitations
Because the database views union data together across model versions, some types of changes are not supported. If you change the data type of an existing auto-tracked field or tracking group, any subsequent deployment of the generated monitor model fails. In order to make changes to data types, you must remove the existing monitor model and create a new one that has a different ID.
Synchronizing and updating monitor models for process applications
Generated dashboards
When a business BPD is run in the Inspector view or the process application snapshot is deployed, monitoring data is collected and sent to a custom dashboard available in Business Space.
The custom dashboard contains a KPI, Instance, and Report tab for each BPD as well as one Diagram tab for the business process.
Each Instances page contains two instances widgets, one for the BPD and one for the process application (if the business process definition contains intermediate tracking events).The values for the activity KPIs (Total time, Wait time, Execution time) are calculated only for activities in the process and not for tracking events or decision nodes.
Business Space dashboards are not deleted or updated when a process is deployed: a new Business Space dashboard is generated.
If you change your process application, you can regenerate the monitor model to capture the updates. This is particularly important when you make changes, such as adding a new tracking event; if you do not update the monitor model, those new events are not monitored.
The Business Space dashboards are owned by the administrator ID for Monitor installation. When you generate a dashboard, you have edit authority for that dashboard.
Monitor process applications with IBM Business Monitor 8.0.1
You use IBM Business Monitor V8.0.1 with BPM V8.5 to provide business monitoring capability for your process applications.
You monitor an IBM Business Process Manager V8.5 process application by importing it into IBM Integration Designer V8.5. You then generate a monitor model and test it in a test environment or deploy it to a production environment.
Because you are using IBM Business Process Manager V8.5 with IBM Business Monitor V8.0.1, complete some additional configuration steps.
- Common Event Infrastructure (CEI) is not configured by default in BPM V8.5, and so the first step is to configure CEI in the BPM cell.
- IBM Business Process Manager V8.5 and IBM Business Monitor V8.0.1 must be installed in separate cells, and so you set up a multiple-cell environment with the BPM event emitter service in the BPM cell.
- You configure your IBM Business Monitor model to receive the events that were emitted to the CEI event service.
After you complete the previous configuration steps, you can begin emitting events to the CEI service.
- Configure Common Event Infrastructure (deprecated) In IBM Business Process Manager Advanced 8.5, the Common Event Infrastructure (CEI) is not enabled by default. You must, therefore, set up CEI in the BPM cell so that you can send events to CEI.
- Configure event flow to a remote server Because IBM Business Process Manager and Business Monitor are not installed in the same cell, and a remote Business Monitor is monitoring emitted events, advanced configuration is required to enable emitted events to flow to the remote Business Monitor server.
- Generating a monitor model for the process application To monitor an IBM Business Process Manager V8.5 process application with Business Monitor V8.0.1, you import the process application into IBM Integration Designer V8.5 and generate a monitor model. You then export the EAR file and deploy it to a server.
- Default metrics and Key Performance Indicators for process applications Generated monitor models contain numerous default metrics and Key Performance Indicators (KPI) for a process application.
- Activity Statistics diagram An Activity Statistics diagram is a visual representation of a business process flow that displays time and cost statistics for the process activities. Activity Statistics diagrams are automatically generated when a default monitor model is generated and the diagrams can be displayed in the Diagrams tab of the generated dashboard. You can change the rendering of the diagram in the Diagrams tab to display different statistics.
Configure Common Event Infrastructure (deprecated)
In IBM Business Process Manager Advanced 8.5, the Common Event Infrastructure (CEI) is not enabled by default. You must, therefore, set up CEI in the BPM cell so that you can send events to CEI.
Before you complete this task, make sure that you verify the following information:
- The value that you use for -datasourceJndiName (for example, jdbc/SharedDb) is accessible from the cluster scope.
- The value that you use for -datasourceAuthAlias (for example, BPM_DB_ALIAS) exists and has the authority to access the database.
- The values that you use for -jmsAuthAlias -user and -password (for example, celladmin/celladmin) correspond to a valid user.
You run a series of wsadmin commands to enable CEI.
- Navigate to the following directory: DMGR_PROFILE/bin/wsadmin
- Configure CEI by entering the wbmDeployCEIEventService command:
- Jython syntax:
- AdminTask.wbmDeployCEIEventService('[-busMember [-cluster clusterName -datasourceJndiName jndiName -datasourceAuthAlias authAlias -databaseSchema schemaName -createTables true] -eventService [-cluster clusterName] -jmsAuthAlias [ -user userName -password userPassword]]')
- Jacl syntax:
- $AdminTask wbmDeployCEIEventService {-busMember {-cluster clusterName -datasourceJndiName jndiName -datasourceAuthAlias authAlias -databaseSchema schemaName -createTables true} -eventService{-cluster clusterName} -jmsAuthAlias {-user userName -password userPassword}}
Where:
- -busMember -cluster clusterName
- is the name of the BPM messaging engine cluster or the single cluster name if a single cluster was created.
- -busMember -datasourceJndiName value
- is an existing value ( jdbc/SharedDb)
- -busMember -datasourceAuthAlias value
- is an existing value ( BPM_DB_ALIAS)
- -eventServices -cluster clusterName
- is the name of the BPM support cluster or the single cluster name if a single cluster was created.
- -jmsAuthAlias -user userName
- is an existing name and is a member of the Administrator group. It must be the same on both the Process Server deployment manager and on the IBM Business Monitor deployment manager in a cross-cell configuration.
- -jmsAuthAlias -password userPassword
- is an existing password and is a member of the Administrator group. It must be the same on both the Process Server deployment manager and on the IBM Business Monitor deployment manager in a cross-cell configuration.
An example of the wbmDeployCEIEventService command follows:
- Jython:
- AdminTask.wbmDeployCEIEventService('[-busMember [-cluster MECluster -datasourceJndiName jdbc/SharedDb -datasourceAuthAlias BPM_DB_ALIAS -databaseSchema CEIME -createTables true] -eventService [-cluster SupCluster] -jmsAuthAlias [ -user celladmin -password celladmin]]')
- Jacl:
- $AdminTask wbmDeployCEIEventService {-busMember {-cluster MECluster -datasourceJndiName jdbc/SharedDb -datasourceAuthAlias BPM_DB_ALIAS -databaseSchema CEIME -createTables true} -eventService{-cluster SupCluster} -jmsAuthAlias {-user celladmin -password celladmin}}
Save the configuration changes by entering one of the following commands:
- Jython:
- AdminConfig.save()
- Jacl:
- $AdminConfig save
- Jython syntax:
- Verify the command you entered in step 2 was successful by completing the following steps:
- Restart the deployment manager and the clusters.
- Check to make sure the CEI bus was created.
- Check to make sure the messaging engine at the CEI bus can be started.
- Enable Business Process Choreographer to emit CEI events:
- DMGR_PROFILE/bin/wsadmin -connType NONE -f WAS_home\ProcessChoreographer\admin\setStateObserver.py -cluster clusterName -enable CEI
Where:
- -cluster clusterName
- is the name of the cluster where Business Process Choreographer is configured
An example of enabling Business Process Choreographer follows:
- DMGR_PROFILE/bin/wsadmin -connType NONE -f P:\bpm8500\ProcessChoreographer\admin\setStateObserver.py -cluster AppCluster -enable CEI
- If you are migrating to BPM V8.5
from an earlier version, configure the CEI emitter factory:
- DMGR_PROFILE/bin/wsadmin -lang jython -f WAS_home\util\migration\scripts\setCEIDestination.py -a applicationClusterName -s supportClusterName -no-sync
Where:
- -a applicationClusterName
- is the name of the application cluster
- -s supportClusterName
- is the name of the support cluster
- –no-sync
- is an optional parameter that specifies whether to synchronize the changes to all nodes. By default, no-sync is false, which means the node synchronize command is called immediately after the change. If no-sync is true, the node synchronize command is not called automatically and you must synchronize the nodes later so the changes take effect.
An example of configuring the CEI emitter factory follows:
- DMGR_PROFILE/bin/wsadmin -lang jython -f P:\bpm8500\util\migration\scripts\setCEIDestination.py -a AppCluster -s SupportCluster
- Verify the command you entered in step 5 was successful by completing the following steps from the administrative console:
- Click Servers > Clusters > WebSphere application server clusters > server_name > Business Process Choreographer > Business Flow Manager.
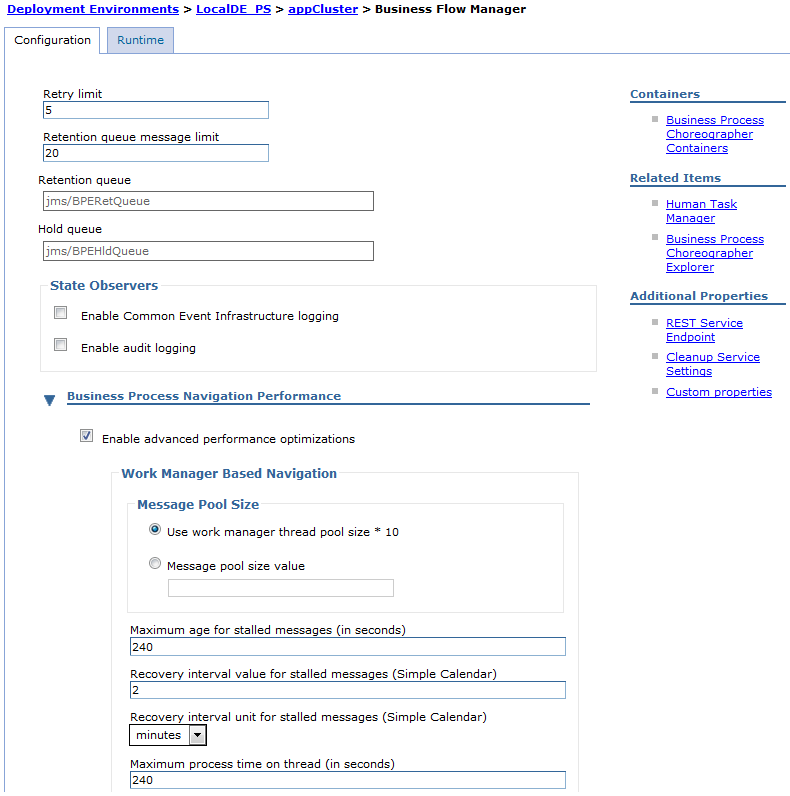
- Make sure that Enable Common Event Infrastructure logging is enabled.
- Click Servers > Clusters > WebSphere application server clusters > server_name > Business Process Choreographer > Human Task Manager.
- Make sure that Enable Common Event Infrastructure logging is enabled.
- Click Service Integration > Common Event Infrastructure, and then click Event emitter factories > Default Common Event Infrastructure emitter > Event service transmission.
- Verify the event service JNDI name is set to the cluster_name you provided ( SupCluster).
- Click Servers > Clusters > WebSphere application server clusters > server_name > Business Process Choreographer > Business Flow Manager.
Related tasks:
Set up a multiple-cell environment with the BPM event emitter service in the BPM cell
IBM Business Monitor CEI event service
setStateObserver.py administrative script
Configure event flow to a remote server
Because IBM Business Process Manager and Business Monitor are not installed in the same cell, and a remote Business Monitor is monitoring emitted events, advanced configuration is required to enable emitted events to flow to the remote Business Monitor server.
Configure the Common Event Infrastructure in BPM, as described in Configure Common Event Infrastructure.
When you monitor IBM Business Process Manager V8.5 with IBM Monitor V8.0.1, you make use of the Common Event Infrastructure (CEI) event service that you configured in the BPM cell. You can use the default SI bus messaging provider, or you can configure WebSphere MQ as the messaging provider.
- Set up a multiple-cell environment with the BPM event emitter service in the BPM cell You set up the BPM event emitter service in the BPM cell so that you can have events emitted to the CEI event service that you configured within the cell.
- Configure event flow to a remote server with WebSphere MQ When you use WebSphere MQ instead of the default messaging provider, you complete additional configuration steps.
Related concepts:
Related tasks:
Configure the CEI event service
Configure table-based event delivery in a multiple-cell environment
Set up a multiple-cell environment with the BPM event emitter service in the BPM cell
You set up the BPM event emitter service in the BPM cell so that you can have events emitted to the CEI event service that you configured within the cell.
Make sure that you have configured CEI in the BPM Advanced V8.5 cell.
CEI is not configured by default in BPM Advanced 8.5.
To set up the multiple-cell environment, you first perform the security tasks of configuring SSL, sharing LTPA keys, and enabling identify assertion. You then configure table-based event delivery. Next, you configure the MONITOR bus in the BPM cell and create a J2C authentication alias named EventEmitterAlias. Finally, you copy a set of files from Business Monitor to BPM and run a series of commands to deploy the event emitter service.
- Configure server-to-server SSL, as described in Configure server-to-server
SSL in multiple-cell environments.
- Share LTPA keys, as described in Sharing LTPA keys.
- Enable identity assertion on the BPM cell, as described in Enable identity assertion.
- Configure table-based event delivery:
- On the remote deployment manager or stand-alone server, run the wbmConfigureQueueBypassDatasource wsadmin command. See Table-based
CEI across multiple cells for an example and list of parameters for this command.
- After you run the command and save the configuration changes, restart the remote deployment manager or stand-alone server.
- On the remote deployment manager or stand-alone server, run the wbmConfigureQueueBypassDatasource wsadmin command. See
- Configure the remote MONITOR bus in the BPM cell.
This step creates a MONITOR bus in the BPM cell and a link to the MONITOR bus in the Business Monitor cell. You can still choose between table-based and queue-based event delivery when you are installing a Business Monitor model.
- From the app_server_root/scripts.wbm/crossCell directory of the local Business Monitor server installation, choose one of the following methods to run the service integration bus cross-cell configuration utility. For more information about this utility, see the related links.
- To run the command interactively, enter:
-

 configRemoteMonitorBus.sh
-
 configRemoteMonitorBus.bat
-
- To run the command using a properties file, review the configRemoteMonitorBus.props file and change any necessary properties. The configRemoteMonitorBus.props file is an example properties file that is located in the app_server_root/scripts.wbm/crossCell directory, but you can create your own properties file for your configuration:
- configRemoteMonitorBus.sh
-props properties_file_name
- configRemoteMonitorBus.bat -props properties_file_name
-
Where:
properties_file_name is the fully qualified name of the properties file that contains the required values for the configuration. The path to the properties file must be fully specified for the script to find the properties file. The cross-cell configuration utility creates a service integration bus in the remote cell. The name of the bus is MONITOR.remote_cell_name.bus, where remote_cell_name is the name of the remote cell.
- To run the command interactively, enter:
- When the script completes, restart both the local Business Monitor server and the remote CEI server.
- From the app_server_root/scripts.wbm/crossCell directory of the local Business Monitor server installation, choose one of the following methods to run the service integration bus cross-cell configuration utility. For more information about this utility, see the related links.
- Verify the remote service integration bus exists and the link between the local and remote buses was created successfully:
- From the administrative console on the remote BPM cell, click Service Integration > Buses.
- Click the MONITOR.cell name.bus bus that you are verifying, where cell name is the name of the cell where the remote CEI server is installed.
- Under Topology, click Messaging Engines. One messaging engine is defined. The Status field displays a green arrow if the messaging engine is active.
- Click the messaging engine, and then click Additional Properties > Service integration bus links. If you are connecting the remote cell to a single monitor installation and a monitor installation to a single remote cell, one link is defined. You can, however, have more than one link.
The Status field displays a green arrow if the link is active.
- To verify using the System.out log, look for a message similar to the message provided here. The messaging engine name is different for each machine:
CWSIP0382I: Messaging engine FADB84EB685E209F responded to subscription request,
Publish Subscribe topology now consistent.
- You can perform the same procedure on the IBM Business Monitor server to validate the IBM Business Monitor server side of the service integration bus link is active.
- Create a J2C authentication alias named EventEmitterAlias on the BPM cell:
- From the administrative console on the remote BPM cell, click Security > Global Security.
- Under Authentication, expand Java Authentication and Authorization Service, and then click J2C authentication data.
- Clear the Prefix new alias names with the node name of the cell (for compatibility with earlier releases) check box.
- Click Apply.
- Click Save.
- Click New and enter EventEmitterAlias for the alias name.
- The J2C authentication alias must be EventEmitterAlias. It must not contain the node name of the cell.
- The user ID and password must be an existing administrator user ID and password for the BPM cell.
- After restarting the deployment manager, start a wsadmin console and run the following commands. Set the -lang
jython option to use the jython syntax.
AdminTask.wbmConfigureEventEmitterFactory(['-cluster', 'support_cluster_name'])
AdminTask.wbmDeployBPMEmitterService(['-cluster', 'support_cluster_name'])
AdminConfig.save()
- Restart the BPM topology.
Related tasks:
Configure Common Event Infrastructure (deprecated)
Configure event flow to a remote server with WebSphere MQ
When you use WebSphere MQ instead of the default messaging provider, you complete additional configuration steps.
Before completing this task configure queue-based event management in a multi-cell environment. Refer to the related link "Configuring queue-based event management in a multiple-cell environment."
You can use WebSphere MQ as the messaging provider, as shown in the diagram and the following steps. In this configuration, BPM and Business Monitor are in separate cells.

To configure the BPM and Business Monitor resources:
- Create a queue in your messaging provider to receive the raw XML events emitted from BPM.
- Deploy the BPM emitter service in the Business Monitor cell. The BPM emitter service deployment creates SI bus resources for all the JMS artifacts. You must re-configure the resources to point to MQ resources. For more information, refer to the related link "Configuring the JMS event emitter service to use the WebSphere MQ messaging provider."
- In the Business Monitor cell, re-configure the JMS queue with a JNDI name of jms/com.ibm.lombardi/JMSEmitterInput to point to an MQ queue.
- In the Business Monitor cell, re-configure the JMS queue connection factory with a JNDI name of jms/com.ibm.lombardi/JMSEmitterInputQueueFactory to point to the MQ queue manager.
- In the Business Monitor cell, re-configure the JMS activation specification named jms/com.ibm.lombardi/JMSEmitterInputActivationSpec so that it points to the same MQ queue reference as the jms/com.ibm.lombardi/JMSEmitterInput JMS queue. For more information about the JMS activation specification, refer to the related link "Using a JMS activation specification to put the event XML into a WebSphere MQ queue."
- In the BPM cell, define a JMS queue with the JNDI name jms/com.ibm.lombardi/EventEmissionQueue. The JMS queue must point to the destination queue, or its corresponding foreign destination.
- In the BPM cell, define a JMS queue connection factory with the JNDI name jms/com.ibm.lombardi/EventEmissionQueueFactory. The connection factory must connect to the messaging destination referenced in the previous step.
Related tasks:
Configure queue-based event management in a multiple-cell environment
Configure the JMS event emitter service to use the WebSphere MQ messaging provider
Use a JMS activation specification to put the event XML into a WebSphere MQ queue
Generating a monitor model for the process application
To monitor an IBM Business Process Manager V8.5 process application with Business Monitor V8.0.1, you import the process application into IBM Integration Designer V8.5 and generate a monitor model. You then export the EAR file and deploy it to a server.
Make sure that you have completed the following tasks:
- You have an IBM Business Process Manager V8.5 process application that is available to be imported from the Process Center into IBM Integration Designer V8.5.
- You have access to the Process Center repository from IBM Integration Designer V8.5. See Access the Process Center repository.
- From IBM Integration Designer V8.5,
complete the following steps to import the process application into the IBM Integration Designer workspace:
- Select a process application.
- Click Open in workspace.
See Import process applications and toolkits from the Process Center repository.
- In IBM Integration Designer, generate a monitor model, as described in Generating custom monitor models for process applications.
- In IBM Integration Designer, export the monitor model as an EAR file, as described in Export modules as EAR files.
- From the Business Monitor V8.0.1 WebSphere Application Server administrative console, deploy the monitor model, using the detailed method, as described in Deploy monitor models.
Default metrics and Key Performance Indicators for process applications
Generated monitor models contain numerous default metrics and Key Performance Indicators (KPI) for a process application.
The default metrics and KPIs are found in the following three parts of a monitor model:
- Monitor details model
- KPI model
- Dimensional model
These three parts and their default metrics and KPIs are discussed in the following three sections.
Monitor details model
When a monitor model is generated, it contains at least one monitoring context definition. A root monitoring context definition is generated for each business process, referenced toolkit, or Blueworks Live process in a process application. The root monitoring context definition includes a child monitoring context definition for the process steps. In addition, a root monitoring context definition is created for the process application as a whole.
The default metrics, triggers, and counters are generated into the default monitor models, but they are also offered for selection in the Generate Monitor Model wizard for generating custom monitor models.
Each activity in a process in the Process Designer authoring environment has the following eight default tracked fields that are associated with it:
- Cost
- Resource Cost
- Labor Cost
- Rework
- Value Add
- Total Time (Clock)
- Wait Time (Clock)
- Execution Time (Clock)
These eight tracked fields, which are referred to as "KPIs" in Process Designer, should not be confused with the KPIs in IBM Business Monitor, which are aggregate values of metrics that are defined in a monitor model (such as min, max, and avg).
When a monitor model is generated, a metric is created in the Process Steps monitoring context to store the value of each of these built-in tracked values. Additionally, the generated monitor model contains a monitor KPI with an aggregation type of Average for each of those eight values.
If custom KPIs are created in Process Designer for the process application, the auto-generated model do not automatically create metrics for the custom KPIs.
The monitoring contexts and their associated metrics, triggers, and counters are described in the following table:
| Monitor context | Metrics, triggers, and counters | Description |
|---|---|---|
| process_name (one instance for each process execution) | Aux Starting Process Instance ID (key metric) | An internal metric that is the key of the monitoring context. It identifies the process execution (instance) that is monitored by this context. |
| process_name Instance ID (metric) | This metric caches the ID of the process instance. | |
| process_name Termination Trigger (trigger) | This internal trigger is fired when one of the following events is received:
| |
| Active Step Names (metric) | A comma-separated list of active step names in the monitored process execution. | |
| Aux Active Step Instance IDs (metric) | An internal metric that captures a comma-separated list of active step instance IDs in a process. This metric is not displayed in any automatically generated dashboards. | |
| Aux Last Completed Step Instance ID (metric) | This is an internal metric to capture the instance ID of the last completed step. It has a default value of ' ' (space). This metric is not displayed in any automatically generated dashboards. | |
| Aux Last Completed Step Name (metric) | This internal metric captures the name of the last completed step. It has a default value of ' ' (space). This metric is not displayed in any automatically generated dashboards. | |
| Aux Last Started Step Instance ID (metric) | This is an internal metric to capture the instance ID of the last started step. It has a default value of ' ' (space). This metric is not displayed in any automatically generated dashboards. | |
| Aux Last Started Step Name (metric) | This is an internal metric to capture the name of the last started step. It has a default value of ' ' (space). This metric is not displayed in any automatically generated dashboards. | |
| Start Time (metric) | The start time of the monitored process execution. | |
| End time (metric) | The end time of the monitored process execution. | |
| Total Time (Clock) (metric) | The total elapsed time of a process execution. It is calculated from the Start Time and End Time metrics. | |
| Tracked Field (metric) | A business process defined in the process application or toolkit can have a set of auto-tracked fields defined by the business user. A metric is generated for each auto-tracked field of type String, Decimal, Integer, Date or Boolean. The metric captures the business data of the latest process event that reported this tracked field. If the Tracked Field metric is of data type Boolean, the corresponding metric will be of type String in the monitor model. And if the tracked field is of type Integer, the generated metric type will be Decimal. Otherwise, it will match the type of the auto-tracked field. | |
| Step Completed (trigger) | This trigger is fired when a step is completed in the monitored process execution. | |
| Step Started (trigger) | This trigger is fired when a new step is started in the monitored process execution. | |
| Steps Active (counter) | The number of active steps running in a process. It is incremented when a Start event arrives for a process step and it is decremented when an End event arrives for a process step. | |
| Steps Completed (counter) | The number of completed steps in a process. The count is incremented when an End event arrives for a process step. | |
| Snapshot ID (metric) | Captures the snapshot ID (version) of the monitored process. | |
| Snapshot Name (metric) | Captures the snapshot name of the monitored process. | |
| State (metric) | Captures the current state of the process step. | |
| process_name Steps (one instance for each step execution)
This monitoring context is a child of the business process execution monitoring context. | Step Instance ID (key metric) | Key of the monitoring context. It identifies the step execution that is being monitored. |
| Called Process Instance ID (metric) | Captures the instance ID of the process that is called by this step. This metric only exists if the process contains a subprocess. | |
| Number of Started Instances (metric) | Captures the number of parallel instances started by a multi-instance Loop activity. | |
| Start Time (metric) | The start time of the process step. | |
| End Time (metric) | The end time of the process step. | |
| Cost (metric) | The cost of running a process step. Captures the value of the associated default tracked field (KPI) Cost in BPM. | |
| Resource Cost (metric) | The resource cost of running a process step. Captures the value of the associated default tracked field (KPI) Resource Cost in BPM. | |
| Labor Cost (metric) | The labor cost of running a process step. Captures the value of the associated default tracked field (KPI) Labor Cost in BPM. | |
| Total Time (Clock) (metric) | The total time of running a process step. Captures the value of the associated default tracked field (KPI) Total Time (Clock) in BPM. | |
| Execution Time (Clock) (metric) | The execution time of a process step. Captures the value of the associated default tracked field (KPI) Execution Time (Clock) in BPM. | |
| Wait Time (Clock) (metric) | The wait time of a process step. Captures the value of the associated default tracked field (KPI) Wait Time (Clock) in BPM. | |
| Rework (metric) | The rework (percent true) of running a process step. Captures the value of the associated default tracked field (KPI) Rework in BPM. | |
| Value Add (metric) | The value add (percent true) of running a process step. Captures the value of the associated default tracked field (KPI) Value Add in BPM. | |
| Step Name (metric) | The name of the process step. | |
| Potential Performer ID (metric) | The user ID of the performer that is assigned to this step. This metric is only populated for steps that are user tasks. | |
| Potential Performer Name (metric) | A performer (user or group) that is assigned to this step. This metric is only populated for steps that are user tasks. | |
| Performer ID (metric) | The user ID of the performer who actually works on this step. This metric is only populated for steps that are user tasks. | |
| Performer Name (metric) | The performer who actually works on this step. This metric is only populated for steps that are user tasks. | |
| Snapshot ID (metric) | The snapshot ID of the monitored process. | |
| Snapshot Name (metric) | The snapshot name of the monitored process. | |
| State (metric) | The current state of the process step. | |
| process_name Steps Termination (trigger) | This internal trigger is fired to terminate the monitoring context instance 30 days after the last event arrived. | |
| auto_tracked_field_name◇ (metric) | Captures the data of an auto-tracked field before the process step is started. This metric is appended with the superscript diamond symbol ◇. | |
| auto_tracked_field_name (metric) | Captures the data of an auto-tracked field after the process step has completed. | |
| process_application_name (one instance for each end-to-end process execution) | Start Process Instance ID (key metric) | The instance identifier of a top-level (main) process execution that starts an end-to-end process chain. |
| auto_tracked_field_name Termination Trigger (trigger) | This is an internal trigger that is fired to terminate the monitoring context instance 30 days after the last event arrived. You can update this trigger to change when the monitoring context is terminated. | |
| auto_tracked_field_name (metric) | Each tracking group defined in the process application has a set of tracked fields defined by the business user. A metric is generated for each tracked field of type Number, Date, and String that has an assigned value. The metric value captures the last value reported for this field by any tracking event emitted during this end-to-end process execution. | |
| Aux timing_interval_name Start Point (metric) | An internal metric that records the start time of a timing interval. This metric is not displayed in any automatically generated dashboards. | |
| Aux timing_interval_name End Point (metric) | An internal metric that records the end time of a timing interval. This metric is not displayed in any automatically generated dashboards. | |
| timing_interval_name (metric) | A metric that captures the duration of a timing interval during the end-to-end process run monitored by this context.
The value is calculated when the end point of the timing interval is reached. As long as the timing interval has not completed, this metric will have no value. For timing intervals defined in a toolkit, the toolkit name is appended to the timing interval name to avoid names clashes that might otherwise occur. The timing interval is calculated
from the following internal metrics:
| |
| Snapshot ID (metric) | The snapshot ID of the monitored process. | |
| tracking_group_name Events (one instance for each custom tracking event that is received)
This monitoring context definition is a child of the process application monitoring context definition. A monitoring context definition is generated for each tracking group defined in the process application or in a referenced toolkit. | Time Emitted (key metric) | The emission time of the custom tracking event captured by this monitoring context (used as the key). |
| Event Name (metric) | The name of the tracking event definition. | |
| tracked_field_name (metric) | Each tracking group defined in a process application has a list of tracked fields defined by the business user. A metric is generated for each tracked field and captures the field value reported by the tracking event received in this monitoring context. | |
| tracking_group_name Events Termination Trigger (trigger) | This trigger terminates the monitoring context as soon as a tracking event is received. (The context is created, updated, and terminated by the same event.) | |
| Snapshot ID (metric) | The snapshot ID of the monitored process. | |
| Snapshot Name (metric) | The snapshot name of the monitored process. | |
| subprocess_name
A KPI context is created for each subprocess. The KPI context name is the fully qualified name of the subprocess. Subprocesses can be nested more than one level deep. | subprocess_name Instance ID (key metric) | This key metric caches the ID of the subprocess instance. |
| subprocess_name Termination Trigger (trigger) | This internal trigger is fired when one of the following events is received:
| |
| Active Step Names (metric) | A comma-separated list of active step names in the monitored subprocess execution. | |
| Aux Active Step Instance IDs (metric) | An internal metric that captures a comma-separated list of active step instance IDs in a subprocess. This metric is not displayed in any automatically generated dashboards. | |
| Aux Last Completed Step Instance ID (metric) | This is an internal metric to capture the instance ID of the last completed step. It has a default value of ' ' (space). This metric is not displayed in any automatically generated dashboards. | |
| Aux Last Completed Step Name (metric) | This is an internal metric to capture the name of the last completed step. It has a default value of ' ' (space). This metric is not displayed in any automatically generated dashboards. | |
| Aux Last Started Step Instance ID (metric) | This is an internal metric to capture the instance ID of the last started step. It has a default value of ' ' (space). This metric is not displayed in any automatically generated dashboards. | |
| Aux Last Started Step Name (metric) | This is an internal metric to capture the name of the last started step. It has a default value of ' ' (space). This metric is not displayed in any automatically generated dashboards. | |
| Start Time (metric) | The start time of the monitored subprocess execution. | |
| End time (metric) | The end time of the monitored subprocess execution. | |
| Total Time (Clock) (metric) | The total elapsed time of a subprocess execution. It is calculated from the Start Time and End Time metrics. | |
| Tracked Field (metric) | A business process defined in the subprocess application or toolkit can have a set of auto-tracked fields defined by the business user. A metric is generated for each auto-tracked field of the String, Decimal, Integer, Date or Boolean types. The metric captures the business data of the latest process event that reported this tracked field. If the Tracked Field metric is of the Boolean data type, the corresponding metric are of the String data type in the monitor model. And if the tracked field is of type Integer, the generated metric type will be Decimal. Otherwise, it will match the type of the auto-tracked field. | |
| Step Completed (trigger) | This trigger is fired when a step is completed in the monitored subprocess execution. | |
| Step Started (trigger) | This trigger is fired when a new step is started in the monitored subprocess execution. | |
| Steps Active (counter) | The number of active steps running in a process. It is incremented when a Start event arrives for a process step and it is decremented when an End event arrives for a subprocess step. | |
| Steps Completed (counter) | The number of completed steps in a process. The count is incremented when an End event arrives for a subprocess step. | |
| Snapshot ID (metric) | Captures the snapshot ID (version) of the monitored subprocess. | |
| Snapshot Name (metric) | Captures the snapshot name of the monitored subprocess. | |
| State (metric) | Captures the current state of the subprocess step. | |
| subprocess_name Steps (one instance for each step execution)
This monitoring context is a child of the Subprocess monitoring context. | Step Instance ID (key metric) | Key of the monitoring context. It identifies the step execution that is being monitored. |
| Called Process Instance ID (metric) | Captures the instance ID of the subprocess that is called by this step. This metric only exists if the subprocess contains a subprocess. | |
| Number of Started Instances (metric) | Captures the number of parallel instances started by a multi-instance loop activity. | |
| Start Time (metric) | The start time of the subprocess step. | |
| End Time (metric) | The end time of the subprocess step. | |
| Cost (metric) | The cost of running a subprocess step. Captures the value of the associated default tracked field (KPI) Cost in BPM. | |
| Resource Cost (metric) | The resource cost of running a subprocess step. Captures the value of the associated default tracked field (KPI) Resource Cost in BPM. | |
| Labor Cost (metric) | The labor cost of running a subprocess step. Captures the value of the associated default tracked field (KPI) Labor Cost in BPM. | |
| Total Time (Clock) (metric) | The total time of running a subprocess step. Captures the value of the associated default tracked field (KPI) Total Time (Clock) in BPM. | |
| Execution Time (Clock) (metric) | The execution time of a subprocess step. Captures the value of the associated default tracked field (KPI) Execution Time (Clock) in BPM. | |
| Wait Time (Clock) (metric) | The wait time of a subprocess step. Captures the value of the associated default tracked field (KPI) Wait Time (Clock) in BPM. | |
| Rework (metric) | The rework (percent true) of running a subprocess step. Captures the value of the associated default tracked field (KPI) Rework in BPM. | |
| Value Add (metric) | The value add (percent true) of running a subprocess step. Captures the value of the associated default tracked field (KPI) Value Add in BPM. | |
| Step Name (metric) | The name of the subprocess step. | |
| Potential Performer ID (metric) | The user ID of the performer that is assigned to this step. This metric is only populated for steps that are user tasks. | |
| Potential Performer Name (metric) | A performer (user or group) that is assigned to this step. This metric is only populated for steps that are user tasks. | |
| Performer ID (metric) | The user ID of the performer who actually works on this step. This metric is only populated for steps that are user tasks. | |
| Performer Name (metric) | The performer who actually works on this step. This metric is only populated for steps that are user tasks. | |
| Snapshot ID (metric) | The snapshot ID of the monitored subprocess. | |
| Snapshot Name (metric) | The snapshot name of the monitored subprocess. | |
| State (metric) | The current state of the subprocess step. | |
| subprocess_name Steps Termination (trigger) | This internal trigger is fired to terminate the monitoring context instance 30 days after the last event arrived. | |
| auto_tracked_field_name◇ (metric) | Captures the data of an auto-tracked field before the subprocess step is started. This metric is appended with the superscript diamond symbol ◇. | |
| auto_tracked_field_name (metric) | Captures the data of an auto-tracked field after the subprocess step has completed. |
Key Performance Indicators model
A monitor KPI with an aggregation type of Average is generated for each default tracked field (KPI) and for every step defined in the business process (which is eight monitor KPIs for each step). Each monitor KPI includes the following information, which is based on the tracked field (KPI) definition in the process model:
- A low, medium, and high range:
- The low range is from 0 (zero) to the minimum threshold defined in the process model. (If there is no minimum threshold or if it is set to 0, the low range is not generated.)
- The medium range is from the minimum threshold to the maximum threshold.
- The high range is from the maximum threshold to the "maximum threshold plus the medium range".
- A KPI target value that is based on the expected threshold defined in the process model.
These KPIs are automatically added to generated monitor models and are available for selection in the Generate Monitor Model wizard used to generate custom monitor models.
The monitor KPIs are summarized in the following table:
| >Monitor KPI | >Description |
|---|---|
| step_name Average Cost | Calculates the average cost of running the referenced process step. |
| step_name Average Resource Cost | Calculates the average resource cost of running the referenced process step. |
| step_name Average Labor Cost | Calculates the average labor cost of running the referenced process step. |
| step_name Average Total Time (Clock) | Calculates the average total time of running the referenced process step. |
| step_name Average Wait Time (Clock) | Calculates the average wait time of the referenced process step. |
| step_name Average Execution Time (Clock) | Calculates the average execution time of the referenced process step. |
| step_name Average Rework (percent true) | Calculates the average rework percentage of running the referenced process step. The Show as a percentage check box is selected by default. There is no range or target associated with this KPI. |
| step_name Average Value Add (percent true) | Calculates the average value add percentage of running the referenced process step. The Show as a percentage check box is selected by default. There is no range or target associated with this KPI. |
| step_name Count | Calculate the total number of instances for a particular process step. |
| process_name Average Total Time (Clock) | Calculates the average total time of running the referenced process. |
Dimensional model
The default measures and dimensions are automatically added to the generated monitor models and are available for selection in the Generate Monitor Model wizard used to generate custom monitor models.
Two dimensions and two cubes are created for each auto-tracked field name. One set of two dimensions and two cubes is created for the value of the metric before the activity starts. Another set of two dimensions and two cubes is created for the value of the metric after the activity completes. The dimensions and measures for the value of the metric before the activity starts are appended with the superscript diamond symbol ◇. For example:
Average OrderNumber◇
The cubes and their associated measures and dimensions are described in the following table:
| >Cubes | >Measures and Dimensions | >Description |
|---|---|---|
| process_name
This cube is generated from the process monitoring context definition. | Average Steps Active (measure) | Captures the average number of active steps in process executions. |
| Average Steps Completed (measure) | Captures the average number of completed steps in process executions. | |
| Average Total Time (Clock) (measure) | Captures the average total time of process executions. | |
| Average auto-tracked_field_name (measure) | An average measure for each auto-tracked field of data type decimal. | |
| process_name (dimension) | A dimension for each auto-tracked field of the string or dateTime data types. | |
| Start Time (dimension) | A dimension for the start time of the monitored process. | |
| End Time (dimension) | A dimension for the end time of the monitored process. | |
| State Dimension (dimension) | The current state of the process step. | |
| process_name Process Steps
This cube is generated from the process steps monitoring context definition. | Average Cost (measure) | Captures the average cost of process steps. |
| Average Resource Cost (measure) | Captures the average resource cost of process steps. | |
| Average Labor Cost (measure) | Captures the average labor cost of process steps. | |
| Average Total Time (Clock) (measure) | Captures the average total time of process steps. | |
| Average Execution Time (Clock) (measure) | Captures the average execution time of process steps. | |
| Average Wait Time (Clock) (measure) | Captures the average wait time of process steps. | |
| Average Value Add (percent true) (measure) | Captures the average value add percentage of process steps. | |
| Average Rework (percent true) (measure) | Captures the average rework percentage of process steps. | |
| Average auto-tracked_field_name (measure) | A measure that captures the average of each auto-tracked field of data type decimal. | |
| auto-tracked_field_name (dimension) | A dimension for each auto-tracked field of data type string or dateTime. | |
| Start Time (dimension) | A dimension for the start time of process steps. | |
| End Time (dimension) | A dimension for the end time of process steps. | |
| Step Name (dimension) | A dimension for the name of process steps. | |
| Potential Performer ID (dimension) | The user ID of the performer that is assigned to this step. This metric is only populated for steps that are user tasks. | |
| Potential Performer Name (dimension) | A performer (user or group) that is assigned to this step. This metric is only populated for steps that are user tasks. | |
| Performer ID (dimension) | The user ID of the performer who actually works on this step. This metric is only populated for steps that are user tasks. | |
| Performer Name (dimension) | The performer who actually works on this step. This metric is only populated for steps that are user tasks. | |
| State Dimension (dimension) | The current state of the process step. | |
| process_application_name App
This cube is generated from the monitoring context definition for a process application. | Average custom_tracked_field_name (measure) | An average measure for the last value reported of each tracked field defined in a custom tracking group that has a data type of decimal. |
| Average timing_interval_name (measure) | An average measure for the referenced timing interval, which must be defined in the process application or a referenced toolkit. | |
| tracked_field_name (dimension) | A dimension for the last value reported of each tracked field defined in a custom tracking group that has a data type of string or dateTime. | |
| tracking_group_name Events
This cube is generated from the monitoring context definition for custom tracking events, which is a child of the monitoring context definition for the process application that defines the corresponding tracking group (as part of the process application itself or in a referenced toolkit). | Time Emitted (dimension) | A dimension for the emission time of custom tracking events. |
| custom_tracked_field_name (dimension) | A dimension for the name of the received custom tracking events. | |
| Average custom_tracked_field_name (measure) | An average measure for each custom tracked field of data type decimal. | |
| custom_tracked_field_name (dimension) | A dimension for each custom tracked field of data type string or dateTime. | |
| subprocess_name
This cube is generated from the subprocess monitoring context definition. The subprocess cube name is a fully qualified name. For example, if you have a subprocess in root process 1, the name will be Root Process 1/Subprocess. If you have a nested subprocess, the name can be Root Process/First Subprocess/Second Subprocess. | Average Steps Active (measure) | Captures the average number of active steps in subprocess executions. |
| Average Steps Completed (measure) | Captures the average number of completed steps in subprocess executions. | |
| Average Total Time (Clock) (measure) | Captures the average total time of subprocess executions. | |
| Averageauto_tracked_field_name (measure) | An average measure for each auto-tracked field of data type decimal. | |
| auto_tracked_field_name (dimension) | A dimension for each auto-tracked field of data type string or dateTime. | |
| Start Time (dimension) | A dimension for the start time of the monitored subprocess. | |
| End Time (dimension) | A dimension for the end time of the monitored subprocess. | |
| State Dimension (dimension) | The current state of the subprocess step. | |
| subprocess_name Subprocess
Steps
This cube is generated from the subprocess steps monitoring context definition. The subprocess cube name is a fully qualified name. For example, if you have a subprocess in root process 1, the name will be Root Process 1/Subprocess Steps. If you have a nested subprocess, the name can be Root Process/First Subprocess/Second Subprocess Steps. | Average Cost (measure) | Captures the average cost of subprocess steps. |
| Average Resource Cost (measure) | Captures the average resource cost of subprocess steps. | |
| Average Labor Cost (measure) | Captures the average labor cost of subprocess steps. | |
| Average Total Time (Clock) (measure) | Captures the average total time of subprocess steps. | |
| Average Execution Time (Clock) (measure) | Captures the average execution time of subprocess steps. | |
| Average Wait Time (Clock) (measure) | Captures the average wait time of subprocess steps. | |
| Average Value Add (percent true) (measure) | Captures the average value add percentage of subprocess steps. | |
| Average Rework (percent true) (measure) | Captures the average rework percentage of subprocess steps. | |
| Average auto_tracked_field_name (measure) | A measure that captures the average of each auto-tracked field of data type decimal. | |
| auto_tracked_field_name (dimension) | A dimension for each auto-tracked field of data type string or dateTime. | |
| Start Time (dimension) | A dimension for the start time of subprocess steps. | |
| End Time (dimension) | A dimension for the end time of subprocess steps. | |
| Step Name (dimension) | A dimension for the name of subprocess steps. | |
| Potential Performer ID (dimension) | The user ID of the performer that is assigned to this step. This metric is only populated for steps that are user tasks. | |
| Potential Performer Name (dimension) | A performer (user or group) that is assigned to this step. This metric is only populated for steps that are user tasks. | |
| Performer ID (dimension) | The user ID of the performer who actually works on this step. This metric is only populated for steps that are user tasks. | |
| Performer Name (dimension) | The performer who actually works on this step. This metric is only populated for steps that are user tasks. | |
| State Dimension (dimension) | The current state of the subprocess step. |
Activity Statistics diagram
An Activity Statistics diagram is a visual representation of a business process flow that displays time and cost statistics for the process activities. Activity Statistics diagrams are automatically generated when a default monitor model is generated and the diagrams can be displayed in the Diagrams tab of the generated dashboard. You can change the rendering of the diagram in the Diagrams tab to display different statistics.
If the business process diagram does not contain any process activities, an Activity Statistics Diagram tab is not generated.
In the Activity Statistics diagram, you can select one of the following radio buttons to display the corresponding KPI and its average value for each process activity:
- Total Time
- The average total time it takes for all process instances to complete an activity.
- Execution Time
- The average amount of time for all process instances between when work is started on an activity and when the work is completed.
- Wait Time
- The average amount of time for all process instances between when an activity is available to be worked on and when work on the activity is started.
- Cost
- Average value of the Cost KPI for the activity for all process instances.
- Resource Cost
- Average value of the Resource Cost KPI for the activity for all process instances.
- Labor Cost
- Average value of the Labor Cost KPI for the activity for all process instances.
The value of the Cost, Labor Cost, and Resource Cost KPIs is always 0 (zero) by default. However, you can change the value in Process Designer by selecting an activity in the process diagram and then selecting the KPIs tab. In the KPIs tab, you can select a default KPI and clear the Use KPI defaults check box, then specify a new value for the KPI.
Related concepts:
Event monitoring reference
IBM Business Process Manager produces monitoring events. These events are sent to IBM Business Monitor so that you can monitor each process application you create and deploy.
Monitor events are emitted by process executions in support of monitoring and should not be confused with process events, which are one-way messages that are part of the behavior of a process.
The monitoring events described in this section are produced by BPMN processes authored in Process Designer. For information on monitoring events for BPEL processes authored in Integration Designer, see the "Event Catalog" topic.
Parts of a monitoring event
The following table describes the significant parts of a monitoring event. Refer to the XML schema for the detailed event format.
Event parts are referenced using standard XPath notation. When elements are nested, this is indicated by a slash (/) separating the element part names. The @ symbol indicates the part is an attribute of the element. The table also indicates if an event part is optional or required.
A copy of the XML schema is provided for reference in the related topic "Event schema extensions."
| Event part | Description | Optional or required | Type |
|---|---|---|---|
| mon:monitorEvent | The root element of an event.
There is one root element per event. | Required | complex |
| mon:monitorEvent/@mon:id | The unique identifier of an event. | Optional | xs:string |
|
mon:monitorEvent/ mon:eventPointData | Describes the nature, the time, and the source of the occurrence reported by the event. There is one mon:eventPointData element per event. | Required | complex |
|
mon:monitorEvent/ mon:eventPointData/ mon:kind | Defines the kind of the event ( bpmnx:PROCESS_STARTED). There is one mon:kind element per event. | Required | xs:Qname |
|
mon:monitorEvent/ mon:eventPointData/ mon:model | Describes an executable model element defining the event emission point ( a human task such as Review Claim).
There is at least one mon:model element per event, but there can be multiple mon:model elements when the event emission point is part of a model-defined hierarchy ( a human task, which is defined within a process that is part of a process application). | Required | complex |
|
mon:monitorEvent/ mon:eventPointData/ mon:model/@mon:type | Specifies the type of the process model element from which the event originated. The value of the mon:type attribute refers to elements defined in the BPMN 2.0 schema ( bpmn:process or bpmn:userTask). | Required | xs:QName |
|
mon:monitorEvent/ mon:eventPointData/ mon:model/ mon:instance | References or describes the instance of the executable model element that emitted the event ( a specific execution of a task). The instance is typically running in an execution environment such as a process engine, but is referenced by the mon:instance element.
There is at most one mon:instance element per mon:model element. In some cases, a mon:model element can occur without a mon:instance element ( when a top-level mon:model element refers to a grouping construct, such as a process application or solution, which does not have runtime instances). | Required | complex |
|
mon:monitorEvent/ mon:eventPointData/ mon:correlation/ mon:ancestor | Contains a hierarchy of correlation identifiers,
which can be auto-generated and created by the process engine or which can be user-defined.
For events that originate from BPM, the <mon:ancestor> tree is populated by the process engine. The <mon:ancestor> elements contain instance identifiers that identify the following items:
Additional correlation identifiers, such as customer order numbers, or claim identifiers, can be added in the mon:correlation section following the <mon:ancestor> tree. The additional identifiers can be used to facilitate correlation across multiple business processes. | Optional | complex |
|
mon:monitorEvent/ mon:eventPointData/ mon:source | Describes the source location where the event originated (or example, a specific server). | Optional | complex |
|
mon:monitorEvent/ mon:eventPointData/ mon:source/ mon:server | Identifies the server on which the event emitter is running. | Optional | complex |
|
mon:monitorEvent/ mon:eventPointData/ mon:source/ mon:server/@mon:type | Indicates the syntax of the server identification ( a URL or an IP address). If a mon:server element is present, a mon:type attribute must be specified to qualify the server identification. | Required | xs:QName |
|
mon:monitorEvent/ mon:applicationData | Contains well-formed XML that is reported by the event-emitting application. This element contains the custom business data in the event, such as tracked field data, tracking point information, or KPI data.
Some events do not include the applicationData element. For more information about the structure of the applicationData, refer to the related topic "Event schema extensions," and the example applicationData provided at the end of this topic. | Optional | complex |
The monitoring event part names begin with the mon namespace prefix, which is bound to the namespace http://www.ibm.com/xmlns/prod/websphere/monitoring/7.5.
The namespace prefix xs, used to designate XML schema types, is bound to http://www.w3.org/2001/XMLSchema.
When multiple <mon:ancestor> elements exist in a <mon:ancestor> tree, you read the tree from the bottom up. In the following example, the mon:ancestor element shown in boldface type is the parent of the first mon:ancestor element:
<mon:correlation>
    <mon:ancestor mon:id="3e888eb2-9c18-4cd5-a9de-3991aeb4f40e.2064.33692aa7-cb0e-4f0a-ac90-b85a5a5687ffT.161.6">
        <mon:ancestor mon:id="3e888eb2-9c18-4cd5-a9de-3991aeb4f40e.2064.33692aa7-cb0e-4f0a-ac90-b85a5a5687ffT.161">
        </mon:ancestor>
    </mon:ancestor>
    <wle:starting-process-instance>3e888eb2-9c18-4cd5-a9de-3991aeb4f40e.2064.33692aa7-cb0e-4f0a-ac90-b85a5a5687ffT.161
<mon:correlation>
In the following monitoring event example, namespace prefixes are bound by the xmlns attributes in the root element.
Monitor event example
<mon:monitorEvent xmlns:mon="http://www.ibm.com/xmlns/prod/websphere/monitoring/7.5"
   mon:id="C1299df7f13ced21792162189"
   xmlns:bpmn="http://schema.omg.org/spec/BPMN/2.0"
   xmlns:bpmnx="http://www.ibm.com/xmlns/bpmnx/20100524/BusinessMonitoring"
   xmlns:ibm="http://www.ibm.com/xmlns/prod/websphere/monitoring/7.5/extensions"
   xmlns:wle="http://www.ibm.com/xmlns/prod/websphere/lombardi/7.5"
   xmlns:xs="http://www.w3.org/2001/XMLSchema">
  <mon:eventPointData>
    <mon:kind mon:version="2010-11-11">bpmnx:PROCESS_STARTED</mon:kind>
    <mon:time mon:of="occurrence">2011-02-03T10:44:13.829-05:00</mon:time>
    <ibm:sequenceId>2</ibm:sequenceId>
    <mon:model mon:type="bpmn:process" mon:id="854325da-04ea-4ea6-8664-c701b4bf3d61"
    mon:version="2064.9d926c59-6511-4ee9-a0d2-4015fb19cb55">
      <mon:name>Ping</mon:name>
      <mon:documentation>The "Ping" process definition.</mon:documentation>
      <mon:instance mon:id="754">
        <mon:state>Active</mon:state>
      </mon:instance>
    </mon:model>
    <mon:model mon:type="wle:processApplication" mon:id="b9e85db9-5c4d-40e7-9421-e53acb738f4e"
    mon:version="2064.9d926c59-6511-4ee9-a0d2-4015fb19cb55">
      <mon:name>Oscillating Invocations</mon:name>
      <mon:documentation>Ping pong between two processes.</mon:documentation>
    </mon:model>
    <mon:correlation>
      <mon:ancestor mon:id="854325da-04ea-4ea6-8664-c701b4bf3d61.2064.9d926c59-6511-4ee9-a0d2-4015fb19cb55.754"/>
      <wle:starting-process-instance>854325da-04ea-4ea6-8664-c701b4bf3d61.2064.9d926c59-6511-4ee9-a0d2-4015fb19cb55.754
      </wle:starting-process-instance>
    </mon:correlation>
  </mon:eventPointData>
</mon:monitorEvent>
applicationData element example
<mon:applicationData>
    <wle:tracking-point wle:time="2011-02-03T10:44:16.054-05:00" wle:name="Call Ping ? (PRE)"
     wle:id="8bfe448-7ceebpdid571234bad276b9a1-4cb5676012c08bfe448-7cd0 (PRE)"
     wle:version="2064.9d926c59-6511-4ee9-a0d2-4015fb19cb55"
     wle:groupName="at12886649788291288665594539"
     wle:groupId="guid:571234bad276b9a1:-4cb56760:12c08bfe448:-7cee"
     wle:groupVersion="2064.9d926c59-6511-4ee9-a0d2-4015fb19cb55">
      <wle:tracked-field wle:name="levelEnteringPong"
        wle:id="bpdid:571234bad276b9a1:-1448ee2a:12c08c263e4:-7fbc"
        wle:type="xs:integer">1</wle:tracked-field>
      <wle:tracked-field wle:name="reportOfWhereInPong"
        wle:id="bpdid:571234bad276b9a1:-1448ee2a:12c08c263e4:-7fba"
        wle:type="xs:string">This is Pong. Called with level = 1.</wle:tracked-field>
      <wle:tracked-field wle:name="argumentForPing"
        wle:id="bpdid:571234bad276b9a1:-1448ee2a:12c08c263e4:-7fb8"
        wle:type="xs:integer"/>
      <wle:kpi-data wle:name="Labor Cost"
         wle:id="fbec4968-5e4c-4f2b-b11b-f3c9ef63d09b"
         wle:version="2064.8d7ade38-7307-4894-a633-9903b7fc69d6"
         wle:type="xs:decimal">0</wle:kpi-data>
      <wle:kpi-data wle:name="Total Time (Clock)"
         wle:id="67cbb213-0032-4f14-be44-7e9c7a1a146f"
         wle:version="2064.8d7ade38-7307-4894-a633-9903b7fc69d6"
         wle:type="xs:dayTimeDuration">P0DT0H0M0S</wle:kpi-data>
      <wle:kpi-data wle:name="Wait Time (Clock)"
         wle:id="43b503bd-63e7-4c42-8268-92d1033e0997"
         wle:version="2064.8d7ade38-7307-4894-a633-9903b7fc69d6"
         wle:type="xs:dayTimeDuration">P0DT0H0M0S</wle:kpi-data>
      <wle:kpi-data wle:name="Resource Cost"
         wle:id="d5da2c80-b2af-40a6-981d-9de4df12ed12"
         wle:version="2064.8d7ade38-7307-4894-a633-9903b7fc69d6"
         wle:type="xs:decimal">0</wle:kpi-data>
      <wle:kpi-data wle:name="Value Add"
         wle:id="e30cf309-a884-4a7b-a2db-16e8a371a4c1"
         wle:version="2064.8d7ade38-7307-4894-a633-9903b7fc69d6"
         wle:type="xs:decimal">1</wle:kpi-data>
      <wle:kpi-data wle:name="Execution Time (Clock)"
         wle:id="8601bb6b-9c9d-4cba-936e-16350a036de3"
         wle:version="2064.8d7ade38-7307-4894-a633-9903b7fc69d6"
         wle:type="xs:dayTimeDuration">P0DT0H0M0S</wle:kpi-data>
      <wle:kpi-data wle:name="Cost"
         wle:id="995ba3fc-e786-45eb-b356-47acb3d3ebbc"
         wle:version="2064.8d7ade38-7307-4894-a633-9903b7fc69d6"
         wle:type="xs:decimal">0.00000000</wle:kpi-data>
      <wle:kpi-data wle:name="Rework"
         wle:id="0f650e6c-a9d7-4355-90bd-06530fa3eeec"
         wle:version="2064.8d7ade38-7307-4894-a633-9903b7fc69d6"
         wle:type="xs:decimal">0</wle:kpi-data>
    </wle:tracking-point>
  </mon:applicationData>
- Process components and monitoring events IBM Business Process Manager emits monitoring events for tracking purposes. Monitoring events are separate from start, end and intermediate process components that are defined in a process model, and are part of the modeled process logic. Use monitoring events for tracking or to capture information when you want to report what a process execution is doing without interfering with the process.
- Process monitoring events When the execution, or instance, of a process has started, completed or failed, or if the process instance has been terminated or deleted, the process state change is reported in a monitoring event.
- Activity monitoring events When an execution, or instance, of an activity has entered a specific state such as ready, active, or completed, the activity state is reported in a monitoring event. In addition, you can configure process activities with simple and multi-instance loops.
- Event monitoring events The monitoring events EVENT_EXPECTED, EVENT_CAUGHT and EVENT_THROWN are used to monitor the execution behavior of the BPMN Start, End and Intermediate events.
- Gateway events Gateways are process modeling elements that control how a process diverges or converges.
- Event schema extensions The XML schema for monitoring events is included in this section for reference purposes. Also included are IBM-specific extensions to the XML schema that define how tracking fields and key performance indicators (KPI) data values are reported.
Related reference:
Process components and monitoring events
IBM Business Process Manager emits monitoring events for tracking purposes. Monitoring events are separate from start, end and intermediate process components that are defined in a process model, and are part of the modeled process logic. Use monitoring events for tracking or to capture information when you want to report what a process execution is doing without interfering with the process.
Two groups of monitoring events are emitted: built-in auto-tracking events and user-defined custom tracking events. Auto-tracking events are emitted when a process execution starts or ends, when a sequence flow is traversed, and when process steps are ready, active, or complete. Custom tracking events are emitted when the process flow passes through an intermediate tracking event node. Intermediate tracking events are added during process authoring or editing.
All events contain information about their origin, or emission point. Using this information, which is grouped in the event point data section of the event, IBM Business Monitor determines the step, the execution, the process, and the server where the event originated. In addition, many events have an application data section, which contains custom business data. For auto-tracking events, the application data section contains the parameters and variables that you designated for auto-tracking in the process definition. For user-defined custom tracking events, the application data section contains the fields defined in the custom tracking group to which that event belongs. Custom tracking groups are data structures defined in a process application specifically for tracking purposes.
The following reference tables show how process components map to monitoring events. For each component that you can use in a business process definition, the tables show the monitoring event or events that can be emitted by the process component at run time. All the events listed are auto-tracking events, except for the intermediate tracking event element.
- Process execution monitoring events
- Activity monitoring events
- Event monitoring events
- Gateway events
Process execution monitoring events
The monitoring events emitted for process executions report the state of the process instance. Subprocesses and event subprocess activities do not emit these events.
| Process state | Process icon | Emitted monitoring event |
|---|---|---|
| The process is started. |
| bpmnx:PROCESS_STARTED |
| The process is completed. | bpmnx:PROCESS_COMPLETED | |
| The process has been terminated. | bpmnx:PROCESS_TERMINATED | |
| The process has been deleted. | bpmnx:PROCESS_DELETED | |
| The process has failed. | bpmnx:PROCESS_FAILED |
For a complete description of the monitoring events emitted for process executions, see the related topic "Process monitoring events."
Activity monitoring events
You can model an activity, such as depositing a payment, in a process definition. When an execution, or instance, of an activity has entered a specific state, such as ready, active, or completed, the activity state is reported in a monitoring event. Tasks, subprocesses, event subprocesses, and call activities can emit these events.
| >Activity state | >Activity icon | >Emitted monitoring event |
|---|---|---|
| An activity is ready. |
| bpmnx:ACTIVITY_READY |
| An activity is active. | bpmnx:ACTIVITY_ACTIVE | |
| An activity is completed; the activity work has finished, but some finalization is still completing. | bpmnx:ACTIVITY_COMPLETED | |
| An activity is terminated. | bpmnx:ACTIVITY_TERMINATED | |
| A resource, such as a user, group or organization, is associated with an activity. | bpmnx:ACTIVITY_RESOURCE_ASSIGNED |
You can configure activities for simple or multi-instance loops in a business process definition. Loops allow an action to be repeated a specified number of times, or until a specific condition is false. In a process definition, simple or multi-instance loop activities are identified by an indicator in the activity icon. Activities configured for loops emit the following events to report the loop control behavior. These events are reported in addition to the usual activity events, listed in the previous table, which occur for every repeated execution. An ACTIVITY_TERMINATED event is emitted when a looped activity cancels the remaining action instances because a complex flow condition is met.
| >Type of looped activity | >Looped activity icon | >Emitted monitoring event |
|---|---|---|
| Activity with simple loops; activity with sequential multiple-instance loops | bpmnx:ACTIVITY_LOOP_CONDITION_TRUE
bpmnx:ACTIVITY_LOOP_CONDITION_FALSE | |
| Activity with parallel multiple-instance loops | 
| bpmnx:ACTIVITY_PARALLEL_INSTANCES_STARTED
bpmnx:ACTIVITY_TERMINATED |
For a complete description of the monitoring events emitted for activities, see the related topic "Activity monitoring events."
Event monitoring events
You can model catching or throwing events in a process definition. These events are part of the process logic and must not be confused with the monitoring events shown in the following table. Events can appear at the beginning of a process or subprocess, end of a process, or during a process or subprocess.
| >Event in the process definition | >Process definition icon | >Emitted monitoring event |
|---|---|---|
| None start event |
| bpmnx:EVENT_CAUGHT |
| Message start event |
| bpmnx:EVENT_CAUGHT |
| Ad hoc start event |
| bpmnx:EVENT_CAUGHT |
| Event subprocess interrupting message start event |
| bpmnx:EVENT_CAUGHT |
| Event subprocess interrupting timer start event |
| bpmnx:EVENT_CAUGHT |
| Event subprocess interrupting error start event |
| bpmnx:EVENT_CAUGHT |
| Event subprocess non-interrupting message start event |
| bpmnx:EVENT_CAUGHT |
| Event subprocess non-interrupting timer start event |
| bpmnx:EVENT_CAUGHT |
| Catching message intermediate event |
| bpmnx:EVENT_EXPECTED
bpmnx:EVENT_CAUGHT |
| Catching timer intermediate event | 
| bpmnx:EVENT_EXPECTED
bpmnx:EVENT_CAUGHT |
| Boundary interrupting message intermediate event |
| bpmnx:EVENT_CAUGHT |
| Boundary interrupting timer intermediate event |
| bpmnx:EVENT_CAUGHT |
| Boundary interrupting error intermediate event |
| bpmnx:EVENT_CAUGHT |
| Boundary non-interrupting message intermediate event |
| bpmnx:EVENT_CAUGHT |
| Boundary non-interrupting timer intermediate event |
| bpmnx:EVENT_CAUGHT |
| Send message intermediate event |
| bpmnx:EVENT_THROWN |
| Tracking intermediate event |
| bpmnx:EVENT_THROWN |
| None end event |
| bpmnx:EVENT_THROWN |
| Message end event |
| bpmnx:EVENT_THROWN |
| Error end event |
| bpmnx:EVENT_THROWN |
| Terminate event |
| bpmnx:EVENT_THROWN |


For more information about Start Events, End Events or Intermediate Events in the process definition, refer to the related topic "Modeling events." A complete description of the monitoring events emitted for start, end or intermediate components in a process definition is provided in the related topic "Event monitoring events."
Gateway events
Gateways are process components that control how a process diverges or converges. In a process definition, gateways can be simple or conditional, join or split. For example, you can use a decision gateway in your process definition when you want to model a point in the process execution where only one of several paths can be followed. At run time, a gateway is activated when one or more tokens have arrived. The number of tokens depends on the gateway configuration, for example, a simple join requires one token on each incoming sequence flow. The gateway evaluates a condition and then emits one or more tokens on outgoing sequence flows. Monitoring events are emitted when a gateway is activated and when it completes.
| >Type of gateway | >Gateway icon | >Emitted monitoring event |
|---|---|---|
| Exclusive gateway |
| bpmnx:GATEWAY_ACTIVATED
bpmnx:GATEWAY_COMPLETED |
| Inclusive gateway |
| bpmnx:GATEWAY_ACTIVATED
bpmnx:GATEWAY_COMPLETED |
| Parallel gateway |
| bpmnx:GATEWAY_ACTIVATED
bpmnx:GATEWAY_COMPLETED |
| Event-based gateway |
| bpmnx:GATEWAY_ACTIVATED
bpmnx:GATEWAY_COMPLETED |


Related reference:
Process monitoring events
When the execution, or instance, of a process has started, completed or failed, or if the process instance has been terminated or deleted, the process state change is reported in a monitoring event.
The event types emitted for process executions are described in the following table.
| Event type | Event description | Required elements |
|---|---|---|
| bpmnx:PROCESS_STARTED | An instance of a process has been started. |
|
| bpmnx:PROCESS_COMPLETED | An instance of a process has been completed. | |
| bpmnx:PROCESS_TERMINATED | An instance of a process has terminated. | |
| bpmnx:PROCESS_DELETED | An instance of a process has been deleted. | |
| bpmnx:PROCESS_FAILED | An instance of a process has failed. | In addition to the required elements described for the other process events, the PROCESS_FAILED event includes these elements:
|
Although a monitoring event must contain at least one <mon:model> element describing the process model and a corresponding <mon:instance> element describing the process execution, in some cases, more than one of these elements can exist in an event. For example, when the deployed process model is part of a higher-level construct, such as a module, application or solution, then the event can include additional <mon:model> elements that describe the construct.
Example PROCESS_STARTED event
<mon:monitorEvent xmlns:mon="http://www.ibm.com/xmlns/prod/websphere/monitoring/7.5"
   mon:id="C1299df7f13ced21792162189" xmlns:bpmn="http://schema.omg.org/spec/BPMN/2.0"
   xmlns:bpmnx="http://www.ibm.com/xmlns/bpmnx/20100524/BusinessMonitoring"
   xmlns:ibm="http://www.ibm.com/xmlns/prod/websphere/monitoring/7.5/extensions"
   xmlns:wle="http://www.ibm.com/xmlns/prod/websphere/lombardi/7.5"
   xmlns:xs="http://www.w3.org/2001/XMLSchema">
  <mon:eventPointData>
    <mon:kind mon:version="2010-11-11">bpmnx:PROCESS_STARTED</mon:kind>
    <mon:time mon:of="occurrence">2011-02-03T10:44:13.829-05:00</mon:time>
    <ibm:sequenceId>2</ibm:sequenceId>
    <mon:model mon:type="bpmn:process" mon:id="854325da-04ea-4ea6-8664-c701b4bf3d61"
      mon:version="2064.9d926c59-6511-4ee9-a0d2-4015fb19cb55">
      <mon:name>Ping</mon:name>
      <mon:documentation>The "Ping" process definition.</mon:documentation>
      <mon:instance mon:id="754">
        <mon:state>Active</mon:state>
      </mon:instance>
    </mon:model>
    <mon:model mon:type="wle:processApplication"
     mon:id="b9e85db9-5c4d-40e7-9421-e53acb738f4e"
     mon:version="2064.9d926c59-6511-4ee9-a0d2-4015fb19cb55">
      <mon:name>Oscillating Invocations</mon:name>
      <mon:documentation>Ping pong between two processes.</mon:documentation>
    </mon:model>
    <mon:correlation>
      <mon:ancestor mon:id="854325da-04ea-4ea6-8664-c701b4bf3d61.2064.9d926c59-6511-4ee9-a0d2-4015fb19cb55.754"/>
      <wle:starting-process-instance>854325da-04ea-4ea6-8664-c701b4bf3d61.2064.9d926c59-6511-4ee9-a0d2-4015fb19cb55.754
      </wle:starting-process-instance>
    </mon:correlation>
  </mon:eventPointData>
</mon:monitorEvent>
Related reference:
Process components and monitoring events
Activity monitoring events
When an execution, or instance, of an activity has entered a specific state such as ready, active, or completed, the activity state is reported in a monitoring event. In addition, you can configure process activities with simple and multi-instance loops.
Monitor activity lifecycle events
The ACTIVITY_READY, ACTIVITY_ACTIVE, ACTIVITY_TERMINATED, and ACTIVITY_COMPLETED event types report the lifecycle states of an activity. Some of these events contain custom business data as well as default key performance indicators (KPI) data. The event types emitted for activities are described in the following table.
| Event type | Event description | Required elements |
|---|---|---|
| bpmnx:ACTIVITY_READY | An instance of an activity is in the ready state.
An activity enters the ready state when a token has arrived.
This event includes custom business data (KPIs and auto-tracked fields) in the applicationData element. |
|
| bpmnx:ACTIVITY_ACTIVE | An instance of an activity is in the active state; required input and resources are available, and work has started. | |
| bpmnx:ACTIVITY_TERMINATED | An instance of an activity has been terminated. | |
| bpmnx:ACTIVITY_COMPLETED | An instance of an activity is in the completed state.
This event includes custom business data (KPIs and auto-tracked fields) in the applicationData element. | |
| bpmnx:ACTIVITY_RESOURCE_ ASSIGNED | A resource, such as a user, group or organization, is associated with a task instance in a specific role. For example, the performer role designates the resource currently assigned to work on the task. |
|
The namespace prefixes mon and bpmn shown in the table represent the following namespace URIs:
- xmlns:mon="http://www.ibm.com/xmlns/prod/websphere/monitoring/7.5"
- xmlns:bpmn="http://schema.omg.org/spec/BPMN/2.0"
ACTIVITY_RESOURCE_ ASSIGNED example
This example of a <mon:resource> element indicates the user assigned to the DeAdmin role, is assigned the PERFORMER role for example 5 of the bpmn:userTask named assignOrderNumber. The activity instance ID is unique within a given process instance, which is described by the <mon:model> element that follows the <mon:resource> element.
<mon:model mon:type="bpmn:userTask"
   mon:id="bpdid:af46278784e183e2:-44d4289d:12ba655e3ba:-7fc0"
   mon:version="2064.69fdfcef-3900-47aa-817a-7960a182a48cT">
      <mon:name>assignOrderNumber</mon:name>
      <mon:instance mon:id="5">
        <mon:role mon:>
          <mon:resource mon:id="User assigned to the DeAdmin role">
            <mon:name>User assigned to the DeAdmin role</mon:name>
          </mon:resource>
        </mon:role>
      </mon:instance>
    </mon:model>
Example ACTIVITY_READY event
In every activity monitoring event, the <mon:model> element describing the activity is followed by a <mon:model> element that describes the process defining the activity, and the process instance from which the event was sent. An additional <mon:model> element describes the process application defining the process. In the following event example, there are three <mon:model> elements, one each for the activity, the process and the process application.
<mon:monitorEvent
   xmlns:mon="http://www.ibm.com/xmlns/prod/websphere/monitoring/7.5"
   mon:id="d12a887ef13ced21792162189"
   xmlns:bpmn="http://schema.omg.org/spec/BPMN/2.0"
   xmlns:bpmnx="http://www.ibm.com/xmlns/bpmnx/20100524/BusinessMonitoring"
   xmlns:ibm="http://www.ibm.com/xmlns/prod/websphere/monitoring/7.5/extensions"
   xmlns:wle="http://www.ibm.com/xmlns/prod/websphere/lombardi/7.5"
   xmlns:xs="http://www.w3.org/2001/XMLSchema">
  <mon:eventPointData>
    <mon:kind mon:version="2010-11-11">bpmnx:ACTIVITY_READY</mon:kind>
    <mon:time mon:of="occurrence">2011-02-03T10:44:15.481-05:00</mon:time>
    <ibm:sequenceId>13</ibm:sequenceId>
    <mon:model mon:type="bpmn:subProcess"
      mon:id="bpdid:571234bad276b9a1:-1448ee2a:12c08c263e4:-7fec"
      mon:version="2064.9d926c59-6511-4ee9-a0d2-4015fb19cb55">
      <mon:name>Call Pong</mon:name>
      <mon:instance mon:id="5"/>
    </mon:model>
    <mon:model mon:type="bpmn:process"
      mon:id="854325da-04ea-4ea6-8664-c701b4bf3d61"
      mon:version="2064.9d926c59-6511-4ee9-a0d2-4015fb19cb55">
      <mon:name>Ping</mon:name>
      <mon:documentation>The "Ping" process definition.</mon:documentation>
      <mon:instance mon:id="754">
        <mon:state>Active</mon:state>
      </mon:instance>
    </mon:model>
    <mon:model
     mon:type="wle:processApplication"
     mon:id="b9e85db9-5c4d-40e7-9421-e53acb738f4e"
     mon:version="2064.9d926c59-6511-4ee9-a0d2-4015fb19cb55">
      <mon:name>Oscillating Invocations</mon:name>
      <mon:documentation>Ping pong between two processes.</mon:documentation>
    </mon:model>
    <mon:correlation>
      <mon:ancestor mon:id="854325da-04ea-4ea6-8664-c701b4bf3d61.2064.9d926c59-6511-4ee9-a0d2-4015fb19cb55.754.5">
        <mon:ancestor mon:id="854325da-04ea-4ea6-8664-c701b4bf3d61.2064.9d926c59-6511-4ee9-a0d2-4015fb19cb55.754"/>
      </mon:ancestor>
      <wle:starting-process-instance>854325da-04ea-4ea6-8664-c701b4bf3d61.2064.9d926c59-6511-4ee9-a0d2-4015fb19cb55.754
      </wle:starting-process-instance>
    </mon:correlation>
  </mon:eventPointData>
  <mon:applicationData>
    <wle:tracking-point
    wle:time="2011-02-03T10:44:15.481-05:00"
    wle:name="Call Pong (PRE)"
    wle:id="8c263e4-7ff2bpdid571234bad276b9a1-1448ee2a12c08c263e4-7fec (PRE)"
    wle:version="2064.9d926c59-6511-4ee9-a0d2-4015fb19cb55"
    wle:groupName="at1288664978829"
    wle:groupId="guid:571234bad276b9a1:-1448ee2a:12c08c263e4:-7ff2"
    wle:groupVersion="2064.9d926c59-6511-4ee9-a0d2-4015fb19cb55">
      <wle:tracked-field
      wle:name="levelEnteringPing"
      wle:id="bpdid:571234bad276b9a1:-1448ee2a:12c08c263e4:-7fc2"
      wle:type="xs:integer">2</wle:tracked-field>
      <wle:tracked-field
      wle:name="reportOfWhereInPing"
      wle:id="bpdid:571234bad276b9a1:-1448ee2a:12c08c263e4:-7fc0"
      wle:type="xs:string">About to call Pong with argument = 1.
      </wle:tracked-field>
      <wle:tracked-field
      wle:name="argumentForPong"
      wle:id="bpdid:571234bad276b9a1:-1448ee2a:12c08c263e4:-7fbe"
      wle:type="xs:integer">1</wle:tracked-field>
    </wle:tracking-point>
  </mon:applicationData>
</mon:monitorEvent>
Looped activity monitoring events
You can configure simple and multi-instance loops for activities in a business process definition. Loops allow an action to be repeated a specified number of times, or until a specific condition is true. In a process definition, simple or multi-instance looped activities are identified by an indicator in the activity icon. The event types emitted for looped activities are described in the following table. These events are emitted in addition to the usual activity monitoring events, which occur for every loop iteration.
| >Event type | >Event description | >Required elements |
|---|---|---|
| ACTIVITY_LOOP_ CONDITION_TRUE
(Simple loop) | This event indicates that a loop condition evaluated
to true. This means the loop is not yet finished and another iteration will occur. The event is issued at each iteration of a loop if the loop condition is true.
When an activity is modeled with simple loops, the required number of instances is dynamically created, up to the specified maximum number of loops. A simple-looped activity is started sequentially until the last instance of the activity has been performed. |
|
| ACTIVITY_LOOP_ CONDITION_FALSE
(Simple loop) | This event indicates that a loop condition evaluated to false. This means the loop is finished and will be exited. The event is issued after the last iteration of a loop, if the loop condition is false. | |
| ACTIVITY_PARALLEL_ INSTANCES_STARTED
(Multi-instance loop) |
This event is issued when multiple instances of an activity are created in parallel. The event reports the number of activity instances that have been created. |
|
| ACTIVITY_TERMINATED
(Multi-instance parallel) | A multi-instance, parallel activity can be configured to terminate all running instances when its flow condition evaluates to true. Each terminated instance emits an ACTIVITY_TERMINATED event. |
|
Simple-looped events occur in a specific pattern, bracketed by an ACTIVITY_READY event at the beginning, and an ACTIVITY_COMPLETED event at the end. For example:
ACTIVITY_READY
ACTIVITY_LOOP_CONDITION_FALSE
ACTIVITY_LOOP_CONDITION_FALSE
ACTIVITY_LOOP_CONDITION_FALSE
ACTIVITY_LOOP_CONDITION_TRUE
ACTIVITY_COMPLETED
Example of a simple looped activity mon:model element
<mon:model mon:type="bpmn:process"
   mon:id="70be5404-7f97-4d15-95c5-2e0a02357978"
   mon:version="2064.cf17230d-0af1-4494-82e7-e0505356a502T">
      <mon:name>Loop: Simple Loop</mon:name>
      <mon:instance mon:id="612">
        <mon:state>Active</mon:state>
      </mon:instance>
    </mon:model>
Related tasks:
Configure an activity for simple looping
Configure an activity for multi-instance looping
Related reference:
Process components and monitoring events
Event monitoring events
The monitoring events EVENT_EXPECTED, EVENT_CAUGHT and EVENT_THROWN are used to monitor the execution behavior of the BPMN Start, End and Intermediate events.
Monitor events
The event monitoring events are described in the following table.
| Event type | Event description | Required elements |
|---|---|---|
| bpmnx:EVENT_EXPECTED | An Intermediate Timer Event in a process definition emits an EVENT_EXPECTED monitoring event when a token arrives and starts the timer. When time is up and the flow continues, an EVENT_CAUGHT monitoring event is emitted. |
|
| bpmnx:EVENT_CAUGHT | A BPMN process is started by a Start Event,
Start Message Event, or Start Ad Hoc Event. These occurrences are reported by an EVENT_CAUGHT monitoring event.
An Intermediate Timer Event can also emit an EVENT_CAUGHT monitoring event to report the timer has started. | |
| bpmnx:EVENT_THROWN | A BPMN process is ended by an End Event, Terminate
Event, or End Exception Event. These occurrences are reported by an EVENT_THROWN monitoring event.
Some Intermediate Events, including Intermediate Message Event, Intermediate Exception Event, and Intermediate Tracking Event, also emit an EVENT_THROWN monitoring event. The event reports that a message was sent, or an exception error or tracking data was created. |
Additional information about Start, End and Intermediate
events is provided in the Business Process Model and Notation (BPMN)
2.0 specification document, which you can download from the Object Management Group website. Sections
10.4.1 through 10.4.4 in the specification document discuss these process model elements.
Example EVENT_CAUGHT event
<mon:monitorEvent
  xmlns:mon="http://www.ibm.com/xmlns/prod/websphere/monitoring/7.5"
  mon:id="Y129bea9f13ced21792162189"
  xmlns:bpmn="http://schema.omg.org/spec/BPMN/2.0"
  xmlns:bpmnx="http://www.ibm.com/xmlns/bpmnx/20100524/BusinessMonitoring"
  xmlns:ibm="http://www.ibm.com/xmlns/prod/websphere/monitoring/7.5/extensions"
  xmlns:wle="http://www.ibm.com/xmlns/prod/websphere/lombardi/7.5"
  xmlns:xs="http://www.w3.org/2001/XMLSchema">
  <mon:eventPointData>
    <mon:kind mon:version="2010-11-11">bpmnx:EVENT_CAUGHT</mon:kind>
    <mon:time mon:of="occurrence">2011-02-03T10:44:14.255-05:00</mon:time>
    <ibm:sequenceId>4</ibm:sequenceId>
    <mon:model
     mon:type="bpmn:startEvent"
     mon:id="bpdid:571234bad276b9a1:-1448ee2a:12c08c263e4:-7fee"
     mon:version="2064.9d926c59-6511-4ee9-a0d2-4015fb19cb55">
      <mon:name>Start</mon:name>
      <mon:instance mon:id="2"/>
    </mon:model>
    <mon:model mon:type="bpmn:process"
     mon:id="854325da-04ea-4ea6-8664-c701b4bf3d61"
     mon:version="2064.9d926c59-6511-4ee9-a0d2-4015fb19cb55">
      <mon:name>Ping</mon:name>
      <mon:documentation>The "Ping" process definition.</mon:documentation>
      <mon:instance mon:id="754">
        <mon:state>Active</mon:state>
      </mon:instance>
    </mon:model>
    <mon:model
     mon:type="wle:processApplication"
     mon:id="b9e85db9-5c4d-40e7-9421-e53acb738f4e"
     mon:version="2064.9d926c59-6511-4ee9-a0d2-4015fb19cb55">
      <mon:name>Oscillating Invocations</mon:name>
      <mon:documentation>Ping pong between two processes.</mon:documentation>
    </mon:model>
    <mon:correlation>
      <mon:ancestor
       mon:id="854325da-04ea-4ea6-8664-c701b4bf3d61.2064.9d926c59-6511-4ee9-a0d2-4015fb19cb55.754.2">
        <mon:ancestor
         mon:id="854325da-04ea-4ea6-8664-c701b4bf3d61.2064.9d926c59-6511-4ee9-a0d2-4015fb19cb55.754"/>
      </mon:ancestor>
      <wle:starting-process-instance>854325da-04ea-4ea6-8664-c701b4bf3d61.2064.9d926c59-6511-4ee9-a0d2-4015fb19cb55.754
      </wle:starting-process-instance>
    </mon:correlation>
  </mon:eventPointData>
  <mon:applicationData>
    <wle:tracking-point
     wle:time="2011-02-03T10:44:14.255-05:00"
     wle:name="Start (POST)" wle:id="c263e4-7ff2bpdid571234bad276b9a1-1448ee2a12c08c263e4-7fee (POST)"
     wle:version="2064.9d926c59-6511-4ee9-a0d2-4015fb19cb55" wle:groupName="at1288664978829"
     wle:groupId="guid:571234bad276b9a1:-1448ee2a:12c08c263e4:-7ff2"
     wle:groupVersion="2064.9d926c59-6511-4ee9-a0d2-4015fb19cb55">
      <wle:tracked-field wle:name="levelEnteringPing"
       wle:id="bpdid:571234bad276b9a1:-1448ee2a:12c08c263e4:-7fc2"
       wle:type="xs:integer">2</wle:tracked-field>
      <wle:tracked-field wle:name="reportOfWhereInPing"
       wle:id="bpdid:571234bad276b9a1:-1448ee2a:12c08c263e4:-7fc0"
       wle:type="xs:string">This is Ping. Called with level = 2.</wle:tracked-field>
      <wle:tracked-field
       wle:name="argumentForPong"
       wle:id="bpdid:571234bad276b9a1:-1448ee2a:12c08c263e4:-7fbe"
       wle:type="xs:integer"/>
    </wle:tracking-point>
  </mon:applicationData>
</mon:monitorEvent>
Related concepts:
Related reference:
Process components and monitoring events
Gateway events
Gateways are process modeling elements that control how a process diverges or converges.
When a gateway is activated by the arrival of one or more tokens, a GATEWAY_ACTIVATED event is emitted. Some gateways, like a simple join, require a token on each incoming sequence flow. When a gateway completes, and sends one or more tokens to the outgoing sequence flow, a GATEWAY_COMPLETED event is produced. The gateway events are described in the following table.
| Event type | Event description | Required elements |
|---|---|---|
| bpmnx:GATEWAY_ACTIVATED | The gateway is activated by the inbound sequence flow. |
|
| bpmnx:GATEWAY_COMPLETED | The gateway is completed and the outbound sequence flow continues. |
Example GATEWAY_COMPLETED event
<mon:monitorEvent
  xmlns:mon="http://www.ibm.com/xmlns/prod/websphere/monitoring/7.5"
  mon:id="c12a558cf13ced21792162189"
  xmlns:bpmn="http://schema.omg.org/spec/BPMN/2.0"
  xmlns:bpmnx="http://www.ibm.com/xmlns/bpmnx/20100524/BusinessMonitoring"
  xmlns:ibm="http://www.ibm.com/xmlns/prod/websphere/monitoring/7.5/extensions"
  xmlns:wle="http://www.ibm.com/xmlns/prod/websphere/lombardi/7.5"
  xmlns:xs="http://www.w3.org/2001/XMLSchema">
  <mon:eventPointData>
    <mon:kind mon:version="2010-11-11">bpmnx:GATEWAY_COMPLETED</mon:kind>
    <mon:time mon:of="occurrence">2011-02-03T10:44:14.982-05:00</mon:time>
    <ibm:sequenceId>11</ibm:sequenceId>
    <mon:model mon:type="bpmn:exclusiveGateway"
     mon:id="bpdid:571234bad276b9a1:-1448ee2a:12c08c263e4:-7fe7"
     mon:version="2064.9d926c59-6511-4ee9-a0d2-4015fb19cb55">
      <mon:name>Call Pong ?</mon:name>
      <mon:instance mon:id="4"/>
    </mon:model>
    <mon:model mon:type="bpmn:process"
     mon:id="854325da-04ea-4ea6-8664-c701b4bf3d61" mon:version="2064.9d926c59-6511-4ee9-a0d2-4015fb19cb55">
      <mon:name>Ping</mon:name>
      <mon:documentation>The "Ping" process definition.</mon:documentation>
      <mon:instance mon:id="754">
        <mon:state>Active</mon:state>
      </mon:instance>
    </mon:model>
    <mon:model mon:type="wle:processApplication"
     mon:id="b9e85db9-5c4d-40e7-9421-e53acb738f4e"
     mon:version="2064.9d926c59-6511-4ee9-a0d2-4015fb19cb55">
      <mon:name>Oscillating Invocations</mon:name>
      <mon:documentation>Ping pong between two processes.</mon:documentation>
    </mon:model>
    <mon:correlation>
      <mon:ancestor mon:id="854325da-04ea-4ea6-8664-c701b4bf3d61.2064.9d926c59-6511-4ee9-a0d2-4015fb19cb55.754.4">
        <mon:ancestor mon:id="854325da-04ea-4ea6-8664-c701b4bf3d61.2064.9d926c59-6511-4ee9-a0d2-4015fb19cb55.754"/>
      </mon:ancestor>
      <wle:starting-process-instance>854325da-04ea-4ea6-8664-c701b4bf3d61.2064.9d926c59-6511-4ee9-a0d2-4015fb19cb55.754
      </wle:starting-process-instance>
    </mon:correlation>
  </mon:eventPointData>
  <mon:applicationData>
    <wle:tracking-point
     wle:time="2011-02-03T10:44:14.982-05:00"
     wle:name="Call Pong ? (POST)"
     wle:id="c263e4-7ff2bpdid571234bad276b9a1-1448ee2a12c08c263e4-7fe7 (POST)"
     wle:version="2064.9d926c59-6511-4ee9-a0d2-4015fb19cb55"
     wle:groupName="at1288664978829"
     wle:groupId="guid:571234bad276b9a1:-1448ee2a:12c08c263e4:-7ff2"
     wle:groupVersion="2064.9d926c59-6511-4ee9-a0d2-4015fb19cb55">
      <wle:tracked-field
       wle:name="levelEnteringPing"
       wle:id="bpdid:571234bad276b9a1:-1448ee2a:12c08c263e4:-7fc2"
       wle:type="xs:integer">2</wle:tracked-field>
      <wle:tracked-field
       wle:name="reportOfWhereInPing"
       wle:id="bpdid:571234bad276b9a1:-1448ee2a:12c08c263e4:-7fc0"
       wle:type="xs:string">This is Ping. Called with level = 2.</wle:tracked-field>
      <wle:tracked-field
       wle:name="argumentForPong"
       wle:id="bpdid:571234bad276b9a1:-1448ee2a:12c08c263e4:-7fbe"
       wle:type="xs:integer"/>
      <wle:kpi-data
       wle:name="Labor Cost"
       wle:id="fbec4968-5e4c-4f2b-b11b-f3c9ef63d09b"
       wle:version="2064.8d7ade38-7307-4894-a633-9903b7fc69d6"
       wle:type="xs:decimal">0</wle:kpi-data>
      <wle:kpi-data
       wle:name="Total Time (Clock)"
       wle:id="67cbb213-0032-4f14-be44-7e9c7a1a146f"
       wle:version="2064.8d7ade38-7307-4894-a633-9903b7fc69d6"
       wle:type="xs:dayTimeDuration">P0DT0H0M0S</wle:kpi-data>
      <wle:kpi-data
       wle:name="Wait Time (Clock)"
       wle:id="43b503bd-63e7-4c42-8268-92d1033e0997"
       wle:version="2064.8d7ade38-7307-4894-a633-9903b7fc69d6"
       wle:type="xs:dayTimeDuration">P0DT0H0M0S</wle:kpi-data>
      <wle:kpi-data
       wle:name="Resource Cost"
       wle:id="d5da2c80-b2af-40a6-981d-9de4df12ed12"
       wle:version="2064.8d7ade38-7307-4894-a633-9903b7fc69d6"
       wle:type="xs:decimal">0</wle:kpi-data>
      <wle:kpi-data
       wle:name="Value Add"
       wle:id="e30cf309-a884-4a7b-a2db-16e8a371a4c1"
       wle:version="2064.8d7ade38-7307-4894-a633-9903b7fc69d6"
       wle:type="xs:decimal">1</wle:kpi-data>
      <wle:kpi-data
       wle:name="Execution Time (Clock)"
       wle:id="8601bb6b-9c9d-4cba-936e-16350a036de3"
       wle:version="2064.8d7ade38-7307-4894-a633-9903b7fc69d6"
       wle:type="xs:dayTimeDuration">P0DT0H0M0S</wle:kpi-data>
      <wle:kpi-data
       wle:name="Cost" wle:id="995ba3fc-e786-45eb-b356-47acb3d3ebbc"
       wle:version="2064.8d7ade38-7307-4894-a633-9903b7fc69d6"
       wle:type="xs:decimal">0.00000000</wle:kpi-data>
      <wle:kpi-data
       wle:name="Rework"
       wle:id="0f650e6c-a9d7-4355-90bd-06530fa3eeec"
       wle:version="2064.8d7ade38-7307-4894-a633-9903b7fc69d6"
       wle:type="xs:decimal">0</wle:kpi-data>
    </wle:tracking-point>
  </mon:applicationData>
</mon:monitorEvent>
Related reference:
Process components and monitoring events
Event schema extensions
The XML schema for monitoring events is included in this section for reference purposes. Also included are IBM-specific extensions to the XML schema that define how tracking fields and key performance indicators (KPI) data values are reported.
Monitor events schema (MonitorEvents.xsd)
<?xml version="1.0" encoding="UTF-8"?>
<xs:schema
        targetNamespace="http://www.ibm.com/xmlns/prod/websphere/monitoring/7.5"
        xmlns:mon="http://www.ibm.com/xmlns/prod/websphere/monitoring/7.5"
        xmlns:xs="http://www.w3.org/2001/XMLSchema"
        elementFormDefault="qualified" attributeFormDefault="qualified" version="2010-12-16">

    <xs:element name="monitorEvent">
        <xs:complexType>
            <xs:sequence>
                <xs:element ref="mon:eventPointData"/>
                <xs:element ref="mon:applicationData" minOccurs="0"/>
            </xs:sequence>
            <xs:attribute name="id" type="xs:string" use="optional"/>
        </xs:complexType>
    </xs:element>

    <xs:element name="eventPointData">
        <xs:complexType>
            <xs:sequence>
                <xs:element ref="mon:kind"/>
                <xs:element ref="mon:time" minOccurs="0" maxOccurs="unbounded"/>
                <xs:element ref="mon:eventPointDataExtension" minOccurs="0" maxOccurs="unbounded"/>
                <xs:element ref="mon:model" minOccurs="0" maxOccurs="unbounded"/>
                <xs:element ref="mon:correlation" minOccurs="0"/>
                <xs:element ref="mon:source" minOccurs="0"/>
            </xs:sequence>
        </xs:complexType>
    </xs:element>
    <xs:element name="eventPointDataExtension" type="mon:Any" abstract="true" />

    <xs:element name="time">
        <xs:complexType>
            <xs:simpleContent>
                <xs:extension base="xs:dateTime">
                    <xs:attribute name="of" type="xs:string" use="optional"/>
                </xs:extension>
            </xs:simpleContent>
        </xs:complexType>
    </xs:element>

    <xs:element name="kind">
        <xs:complexType>
            <xs:simpleContent>
                <xs:extension base="xs:QName">
                    <xs:attribute name="version" type="xs:string" use="optional"/>
                </xs:extension>
            </xs:simpleContent>
        </xs:complexType>
    </xs:element>

    <xs:complexType name="ElementWithId" abstract="true">
        <xs:sequence>
            <xs:element name="name" type="xs:string" minOccurs="0"/>
            <xs:element ref="mon:documentation" minOccurs="0" maxOccurs="unbounded"/>
        </xs:sequence>
        <xs:attribute name="id" type="xs:string" use="required"/>
    </xs:complexType>

    <xs:element name="documentation">
        <xs:complexType>
            <xs:simpleContent>
                <xs:extension base="xs:string">
                    <xs:attribute name="textFormat" type="xs:string" use="optional"/>
                </xs:extension>
            </xs:simpleContent>
        </xs:complexType>
    </xs:element>

    <xs:element name="model">
        <xs:complexType>
            <xs:complexContent>
                <xs:extension base="mon:ElementWithId">
                    <xs:sequence>
                        <xs:element ref="mon:modelExtension" minOccurs="0" maxOccurs="unbounded"/>
                        <xs:element ref="mon:instance" minOccurs="0" />
                    </xs:sequence>
                    <xs:attribute name="type" type="xs:QName" use="required"/>
           <xs:attribute name="version" type="xs:string" use="optional"/>
                </xs:extension>
            </xs:complexContent>
        </xs:complexType>
     </xs:element>
    <xs:element name="modelExtension" type="mon:Any" abstract="true" />

    <xs:element name="instance">
        <xs:complexType>
            <xs:complexContent>
                <xs:extension base="mon:ElementWithId">
                    <xs:sequence>
                        <xs:element name="state" type="xs:string" minOccurs="0"/>
                        <xs:element name="started" type="xs:nonNegativeInteger" minOccurs="0"/>
                        <xs:element name="startedId" minOccurs="0">
                            <xs:simpleType>
                                <xs:list itemType="xs:string"/>
                            </xs:simpleType>
                        </xs:element>
                        <xs:element ref="mon:fault" minOccurs="0"/>
                        <xs:element ref="mon:role" minOccurs="0" maxOccurs="unbounded"/>
                        <xs:element ref="mon:instanceExtension" minOccurs="0" maxOccurs="unbounded"/>
                    </xs:sequence>
                </xs:extension>
            </xs:complexContent>
        </xs:complexType>
    </xs:element>
    <xs:element name="instanceExtension" type="mon:Any" abstract="true" />

    <xs:element name="fault">
        <xs:complexType>
            <xs:simpleContent>
                <xs:extension base="xs:string">
                    <xs:attribute name="name" type="xs:QName" use="optional"/>
                </xs:extension>
            </xs:simpleContent>
        </xs:complexType>
    </xs:element>

    <xs:element name="role">
        <xs:complexType>
            <xs:complexContent>
                <xs:extension base="mon:ElementWithId">
                    <xs:sequence>
                        <xs:element ref="mon:resource" minOccurs="1" maxOccurs="unbounded"/>
                    </xs:sequence>
                </xs:extension>
            </xs:complexContent>
        </xs:complexType>
    </xs:element>

    <xs:element name="resource">
        <xs:complexType>
            <xs:complexContent>
                <xs:extension base="mon:ElementWithId">
                    <xs:sequence>
                        <xs:element ref="mon:resourceExtension" minOccurs="0" maxOccurs="unbounded"/>
                    </xs:sequence>
                </xs:extension>
            </xs:complexContent>
        </xs:complexType>
    </xs:element>
    <xs:element name="resourceExtension" type="mon:Any" abstract="true" />

    <xs:element name="correlation">
        <xs:complexType>
            <xs:sequence>
                <xs:element ref="mon:ancestor" minOccurs="0"/>
                <xs:element ref="mon:correlationExtension" minOccurs="0" maxOccurs="unbounded"/>
            </xs:sequence>
        </xs:complexType>
    </xs:element>
    <xs:element name="correlationExtension" type="mon:Any" abstract="true" />

    <xs:element name="ancestor">
        <xs:complexType>
            <xs:complexContent>
                <xs:extension base="mon:ElementWithId">
                    <xs:sequence>
                        <xs:element ref="mon:ancestor" minOccurs="0" maxOccurs="unbounded"/>
                    </xs:sequence>
                </xs:extension>
            </xs:complexContent>
        </xs:complexType>
    </xs:element>

    <xs:element name="source">
        <xs:complexType>
            <xs:sequence>
                <xs:element ref="mon:server" minOccurs="0" maxOccurs="unbounded"/>
                <xs:element ref="mon:sourceExtension" minOccurs="0" maxOccurs="unbounded"/>
            </xs:sequence>
        </xs:complexType>
    </xs:element>
    <xs:element name="sourceExtension" type="mon:Any" abstract="true" />

    <xs:element name="server">
        <xs:complexType>
            <xs:simpleContent>
                <xs:extension base="xs:string">
                    <xs:attribute name="type" type="xs:QName" use="required"/>
                </xs:extension>
            </xs:simpleContent>
        </xs:complexType>
    </xs:element>

    <xs:element name="applicationData">
        <xs:complexType>
            <xs:sequence>
                <xs:element ref="mon:applicationDataExtension" minOccurs="0" maxOccurs="unbounded" />
            </xs:sequence>
        </xs:complexType>
    </xs:element>
    <xs:element name="applicationDataExtension" type="mon:Any" abstract="true" />

    <xs:complexType name="Any" mixed="true">
        <xs:sequence>
            <xs:any minOccurs="0" maxOccurs="unbounded" processContents="skip"/>
        </xs:sequence>
        <xs:anyAttribute/>
    </xs:complexType>

</xs:schema>
The following extensions to the monitoring event schema define additional supplied fields in the event point data section of the monitoring events, and how tracking fields and KPI data values are reported in the application data section.
IBM extensions to the monitoring event schema
<?xml version="1.0" encoding="UTF-8"?>
<xs:schema
        targetNamespace="http://www.ibm.com/xmlns/prod/websphere/monitoring/7.5/extensions"
        xmlns:ibm="http://www.ibm.com/xmlns/prod/websphere/monitoring/7.5/extensions"
        xmlns:mon="http://www.ibm.com/xmlns/prod/websphere/monitoring/7.5"
        xmlns:xs="http://www.w3.org/2001/XMLSchema"
        elementFormDefault="qualified" attributeFormDefault="qualified" version="2010-12-16">

    <xs:import namespace="http://www.ibm.com/xmlns/prod/websphere/monitoring/7.5" schemaLocation="MonitorEvents.xsd"/>

    <xs:element name="sequenceId" type="ibm:ColonSeparatedNumbers" substitutionGroup="mon:eventPointDataExtension"/>
    <xs:element name="label" type="ibm:String" substitutionGroup="mon:eventPointDataExtension"/>

    <xs:element name="principal" type="ibm:String" substitutionGroup="mon:instanceExtension"/>

    <xs:element name="WBISESSION_ID" type="ibm:String" substitutionGroup="mon:correlationExtension"/>

    <xs:element name="application" type="ibm:TypedString" substitutionGroup="mon:sourceExtension" />
    <xs:element name="server" type="ibm:TypedString" substitutionGroup="mon:sourceExtension" />
    <xs:element name="osProcessAndThreadId" type="ibm:ColonSeparatedNumbers" substitutionGroup="mon:sourceExtension"/>

    <xs:complexType name="ColonSeparatedNumbers">
        <xs:simpleContent>
            <xs:restriction base="mon:Any">
                <xs:simpleType>
                    <xs:restriction base="xs:string">
                        <xs:pattern value="[0-9]+(:[0-9]+)*"/>
                    </xs:restriction>
                </xs:simpleType>
            </xs:restriction>
        </xs:simpleContent>
    </xs:complexType>

    <xs:complexType name="String">
        <xs:simpleContent>
            <xs:restriction base="mon:Any">
                <xs:simpleType>
                    <xs:restriction base="xs:string" />
                </xs:simpleType>
            </xs:restriction>
        </xs:simpleContent>
    </xs:complexType>

    <xs:complexType name="TypedString">
        <xs:simpleContent>
            <xs:restriction base="mon:Any">
                <xs:simpleType>
                    <xs:restriction base="xs:string" />
                </xs:simpleType>
                <xs:attribute name="type" type="xs:string" use="required"/>
            </xs:restriction>
        </xs:simpleContent>
    </xs:complexType>

</xs:schema>
Tracking point extensions to the monitoring event schema
<?xml version="1.0" encoding="UTF-8"?>
<xs:schema targetNamespace="http://www.ibm.com/xmlns/prod/websphere/lombardi/7.5"
 xmlns:wle="http://www.ibm.com/xmlns/prod/websphere/lombardi/7.5"
 xmlns:mon="http://www.ibm.com/xmlns/prod/websphere/monitoring/7.5"
 xmlns:xs="http://www.w3.org/2001/XMLSchema" elementFormDefault="qualified"
 attributeFormDefault="qualified" version="2010-12-16">

 <xs:import namespace="http://www.ibm.com/xmlns/prod/websphere/monitoring/7.5" schemaLocation="MonitorEvents.xsd" />

 <xs:element name="snapshot-name" type="wle:String" substitutionGroup="mon:modelExtension" />
 <xs:element name="starting-process-instance" type="wle:String" substitutionGroup="mon:correlationExtension" />
 <xs:element name="tracking-point" type="wle:TrackingPoint" substitutionGroup="mon:applicationDataExtension" />

    <xs:complexType name="String">
        <xs:simpleContent>
            <xs:restriction base="mon:Any">
                <xs:simpleType>
                    <xs:restriction base="xs:string" />
                </xs:simpleType>
            </xs:restriction>
        </xs:simpleContent>
    </xs:complexType>

 <xs:complexType name="TrackingPoint">
  <xs:complexContent>
   <xs:restriction base="mon:Any">
    <xs:sequence>
     <xs:element name="tracked-field" type="wle:TrackedField" minOccurs="0" maxOccurs="unbounded" />
     <xs:element name="kpi-data" type="wle:TrackedField" minOccurs="0" maxOccurs="unbounded" />
    </xs:sequence>
    <xs:attribute name="time" type="xs:dateTime" use="optional" />
    <xs:attribute name="name" type="xs:string" use="optional" />
    <xs:attribute name="id" type="xs:string" use="required" />
    <xs:attribute name="version" type="xs:string" use="optional" />
    <xs:attribute name="description" type="xs:string" use="optional" />
    <xs:attribute name="groupName" type="xs:string" use="optional" />
    <xs:attribute name="groupId" type="xs:string" use="required" />
    <xs:attribute name="groupVersion" type="xs:string" use="optional" />
    <xs:attribute name="groupDescription" type="xs:string" use="optional" />
   </xs:restriction>
  </xs:complexContent>
 </xs:complexType>

 <xs:complexType name="TrackedField">
  <xs:simpleContent>
   <xs:extension base="xs:string">
    <xs:attribute name="name" type="xs:string" use="required" />
    <xs:attribute name="id" type="xs:string" use="required" />
    <xs:attribute name="version" type="xs:string" use="optional" />
    <xs:attribute name="description" type="xs:string" use="optional" />
    <xs:attribute name="type" type="xs:QName" use="required" />
   </xs:extension>
  </xs:simpleContent>
 </xs:complexType>

 <xs:simpleType name="trackedFieldType">
  <xs:restriction base="xs:string">
   <xs:enumeration value="number" />
   <xs:enumeration value="string" />
  </xs:restriction>
 </xs:simpleType>

</xs:schema>
Related concepts:
Related reference:
Troubleshooting business monitoring for process applications
You can discover and fix problems that you find when you create, update, or delete monitor models for process applications.
Deployment of updated monitor model fails after changes to data types
Because the database views aggregate data together across model versions, some types of changes are not supported. If you change the data type of an existing auto-tracked field or tracking group, any subsequent deployment of the generated monitor model fails. In order to make changes to data types, you must remove the existing monitor model and create a new one that has a different ID.
Monitor model fails to deploy from IBM Integration Designer
You are attempting to deploy a monitor model while logged into IBM Integration Designer as a user who does not have authority to deploy monitor models.
The SystemOut file contains the following error message:
CWWMH0271E:
Authorization failure. Insufficient authority to create a business-level
application. This operation requires "deployer" or "configurator"
role on the cell
To resolve this problem.
- Log in to the administrative console.
- Click Users and Groups > Administrative User roles or Users and Groups > Administrative Group roles.
- Select your user or group to open it.
- Under Roles, select Deployer and click OK.
- Retry the model deployment.
Failed events after running a BPD in the Inspector or Process Portal
After a business process definition is run in the Inspector or Process Portal, you might see failed events in the monitor error queue. This problem can occur across three different scenarios:
- This problem occurs when a business process definition process instance is started but no monitor model is deployed to consume the emitted events. When you later deploy a monitor model and subsequently complete the original process instance, the events go to the Failed Events queue with an instance correlation error because the monitor instance creation events were emitted before the monitor model was deployed.
- This problem also occurs if multiple versions of a monitor model are deployed and an active instance from an earlier monitor model version is being worked on or completed. Events from that active instance are delivered to the new model version where the parent instance was not created because the instance was instantiated before the new model version being deployed. Events for this instance are routed to the error queue when they cannot be correlated with the new model version. However, these events will be successfully consumed by the earlier model version.
- Finally, this problem can also occur if updates are made to a BPD and the process application is run without running File> Update tracking definitions, and there are active instances from a previous run. When you changed the BPD and saved it, a new version ID is internally assigned for the BPD. When the earlier instance resumes, it runs in the in the new version. The events for the instance that is already in progress, will not correlate because the events contain a new version ID.
Related concepts:
Use IBM Business Monitor with process applications
Related tasks:
Update a generated monitor model
Configure transaction properties for an application server
Cloning toolkits in the Process Center console
Monitor system performance
Monitor system performance enables you to assess performance and evaluate the overall progress of service components that make up the applications deployed on your system. Monitoring the overall performance of the system is essential to understand the performance of application servers, databases, and any other systems critical to applications. Monitoring the throughput of Service Component Architecture (SCA) requests helps you understand the flow of requests for specific SCA modules, requesters, and providers. You can also configure IBM Business Process Manager to capture the data in a service component at certain event points.
- Service component monitoring overview A conceptual overview of the reasons you monitor service components; which event points within the service components you select to monitor; and, how to configure monitoring on your system.
- Enable and configuring service component monitoring To be able to monitor service components, you must first enable the monitoring capabilities. Then you must specify the events you want to monitor, the information you want to capture from the event, and the method used to publish the results.
- View monitored events There are a number of ways for you to view the published results of your monitored events, depending on the type of monitoring you are using. This section presents methods that you can use to view performance data, event logs, and service component events stored on a Common Event Infrastructure database.
- Event catalog The event catalog contains the specifications for all the events that can be monitored for each service component type, and the associated Common Base Event extended data elements produced by each event.
Service component monitoring overview
A conceptual overview of the reasons you monitor service components; which event points within the service components you select to monitor; and, how to configure monitoring on your system.
IBM Business Process Manager provides capabilities for monitoring service components to aid in system administration functions, such as performance tuning and problem determination. It goes beyond these traditional functions by also providing the capability for persons who are not necessarily information technology specialists to continually monitor the processing of the service components within the applications deployed on your system. By overseeing the overall processing flow of the interconnected components, you can ensure that your system is producing what you expect it to produce.
IBM Business Process Manager operates on top of an installation of WebSphere Application Server, and, consequently, uses much of the functionality of the application server infrastructure for monitoring system performance and troubleshooting. It also includes some extra functionality that is designed for monitoring service components. This section focuses on how you monitor server-specific service components. It is intended to supplement the monitoring and troubleshooting topics found in the WebSphere Application Server Information Center; therefore; refer to that documentation for details of the other monitoring capabilities in the combined product.
- Why use monitoring? You monitor service components within BPM to assess performance, to troubleshoot problems, and to evaluate the overall processing progress of service components that make up the applications deployed on your system.
- What do you monitor? You can monitor service component events in BPM by selecting certain points that a service component event reaches during processing. Each service component defines these event points, which generate (or "fire") an event when the application processes at that given point. You can also monitor performance statistics for service component events.
- How do you enable monitoring? There are several methods that you can use to specify service component event points for monitoring, depending on the type of monitoring you are planning to do.
Related concepts:
 "Monitoring" in the WAS information center
Why use monitoring?
You monitor service components within BPM to assess performance, to troubleshoot problems, and to evaluate the overall processing progress of service components that make up the applications deployed on your system.
Service components are the integral functions incorporated into IBM Business Process Manager, with which you can create and deploy applications on your system that mirror the processes employed in your enterprise. Effectively monitoring those service components is, therefore, essential to managing the tasks the server is intended to accomplish. There are three main reasons you need to monitor service components on the server:
- Problem determination
- You can diagnose particular errors by using the logging and tracing facilities provided by WebSphere Application Server, which underlies IBM Business Process Manager. For example, if a particular application is not producing the expected results, you can set up a logger to monitor the processing of the service components that make up that application. You can have the log output published to a file, which you can then examine to pinpoint the cause of the problem. Troubleshooting is a task that is of importance to system administrators and others concerned with the maintenance of system hardware and software.
- Performance tuning
- You can monitor certain performance statistics that most process server-specific service components produce. Use this information to maintain and tune your system health, and ensure that applications are tuned optimally and efficiently. You can also spot situations where one or more of your services are performing at a poor level, which may indicate that other problems are present in your system. Like problem determination, performance tuning is a task typically performed by information technology specialists.
- Assessing the processing of service components
- Problem determination and performance tuning are tasks you perform on a short-term basis, to solve a particular issue or problem. You can also set up the process server to continually monitor the service components incorporated into the applications deployed on your system. This type of service component monitoring is of importance to those who are responsible for designing, implementing, and ensuring the processes achieve their design goals, and may be accomplished persons who are not necessarily specialists in information technology.
Related concepts:
Monitor service component events
What do you monitor?
You can monitor service component events in BPM by selecting certain points that a service component event reaches during processing. Each service component defines these event points, which generate (or "fire") an event when the application processes at that given point. You can also monitor performance statistics for service component events.
Regardless of the type of monitoring you intend to perform on your service components (problem determination, performance tuning, or process monitoring), you monitor a certain point that is reached during processing. This point is referred to as an event point, and it is these points that you select to be monitored. Each event point encapsulates the service component kind tag, an optional element kind (which are specific functions of a service component type), and the nature of the event. All these factors determine the type of event generated by monitoring.
Event natures describe the situations required to generate events during the processing of service components. These natures are key points in the logic structure of a service component that you select to be monitored. The most common natures for service component events are ENTRY, EXIT, and FAILURE, but there are many other natures depending on the particular component and element. Whenever an application containing the specified service component is later invoked, an event is fired every time the processing of a service component crosses the points corresponding to the event nature.
As an example of how events are defined for a service component kind, the MAP service component kind can directly fire events with natures of ENTRY, EXIT, and FAILURE. It also includes an element kind, called Transformation, which defines a specific type of functionality within the MAP component kind. This element also fires events with ENTRY, EXIT, and FAILURE natures. Consequently, the MAP service component kind can fire up to six different events depending on the combination of elements and natures specified. The list of all service components, their elements, and their event natures is contained in the event catalog.
Monitor is a separate layer of functionality that lies atop the processing of applications, and does not interfere with the processing of your service components. Monitoring is concerned with service component processing only insofar as it detects activity at a specified event point. When activity is detected, an event is fired by monitoring, which determines where the event is sent, and what data is contained in that event, based on the type of monitoring you are performing:
- Performance metrics
- If you are monitoring a service component in order to gather performance metrics, light weight events are fired to the Performance Monitoring Infrastructure. You can select for monitoring one or more of the three performance statistics generated for server-specific server components:
- A counter for each EXIT event nature - counts successful computations.
- A counter for each FAILURE event nature - counts failed computations
- The processing duration calculated between corresponding ENTRY and EXIT events (synchronous computations only).
- You can also monitor the performance of applications at the Service Component Architecture (SCA) level by using Application Response Measurement (ARM) statistics. These measures allow you to monitor an application at a much finer level of detail within the application than is otherwise available in other service component events. You can use these statistics to monitor many different points between initial application call invocations and service responses, when they use the SCA.
- Service component events with business objects
- To capture the data from events fired by monitoring at specified event points in service component, then you would configure the server to generate the event and its data to be encoded in Common Base Event formats. You can specify the level of detail of business object data to capture in each service component event. You can publish these events to either a logger or to the Common Event Infrastructure (CEI) bus, which directs the output to a specially configured CEI server database.
Related concepts:
Monitor service component events
Related reference:
Performance Monitoring Infrastructure statistics
How do you enable monitoring?
There are several methods that you can use to specify service component event points for monitoring, depending on the type of monitoring you are planning to do.
- Performance statistics
- For Performance Monitoring Infrastructure (PMI) statistics, use the administrative console to specify the particular event points and their associated performance measurements to monitor.
After you start monitoring service component performance, the generated statistics are published at certain intervals to the Tivoli Performance Viewer. You can use this viewer to watch the results as they occur on your system, and, optionally, log the results to a file that can be later viewed and analyzed within the same viewer.
For Application Response Measurement (ARM) statistics, use the administrative console Request Metrics section to specify and the statistics you want to monitor.
- Common Base Events for problem determination and business process monitoring
- You can specify, at the time you create an application, to monitor service component event points, along with a certain level of detail for those events, on a continual basis after the application is deployed on a running server. You can also select event points to monitor after the application has been deployed and the events invoked at least once. In both cases, the events generated by monitoring are fired
across the Common Event Infrastructure (CEI) bus. These events can be published to a log file, or to a configured CEI Server database.
The CEI Server database is not configured by default; you must manually configure this database to use it. Be aware that using the CEI Server database in a production environment can result in degraded performance.
IBM Business Process Manager supports two types of Common Base Event enablement for problem determination and business process monitoring:
- Static
- Certain events points within an application and their level of detail can be tagged for monitoring using Integration Designer tools. The selections indicate what event points are to be continuously monitored, and are stored in a file with a .mon extension that is distributed and deployed along with the application. When IBM Business Process Manager has been configured to use a CEI server, the monitoring function begins firing service component events to a CEI server whenever the specified services are invoked. As long as the application is deployed on IBM Business Process Manager, the service component event points specified in the .mon file is constantly monitored until the application is stopped. You can specify additional events to be monitored in a running application, and increase the detail level for event points that are already monitored. But while that application remains active you cannot stop, or lower the detail level of, the monitored event points specified by the .mon of the deployed application.
- Dynamic
- If additional event points need to be monitored during the processing of an application without shutting down the server, then you can use dynamic monitoring. Use the administrative console to specify service component event points for monitoring, and set detail level for the payload that will be included in the Common Base Event. A list is compiled of the event points that have been reached by a processed service component after the server was started. Choose from this list individual event points or groups of event points for monitoring, with the service component events directed either to the logger or to the CEI server database.
The primary purpose of the Dynamic enablement is for creating correlated service component events that are published to logs, which allow you to perform problem determination on services. Service component events can be large, depending on how much data is being requested, and can tax database resources if you choose to send events to the CEI server. Consequently, you should publish dynamically monitored events to the CEI server only to read the business data of the events, or if you otherwise need to keep a database record of the events. If, however, you are monitoring a particular session, then you need to use the CEI server database to access the service component events related to that session.
Related concepts:
Related tasks:
Getting performance data from request metrics
Enable and configuring service component monitoring
To be able to monitor service components, you must first enable the monitoring capabilities. Then you must specify the events you want to monitor, the information you want to capture from the event, and the method used to publish the results.
- Monitor performance Performance measurements are available for service component event points, and are processed through the Performance Monitoring Infrastructure. You configure a server to gather performance metrics from service component event points. You can also collect Service Component Architecture-specific performance statistics directly from service invocations of applications.
- Monitor service component events IBM Business Process Manager monitoring can capture the data in a service component at a certain event point. You can view each event in a log file, or you can use the more versatile monitoring capabilities of a Common Event Infrastructure server.
Monitor performance
Performance measurements are available for service component event points, and are processed through the Performance Monitoring Infrastructure. You configure a server to gather performance metrics from service component event points. You can also collect Service Component Architecture-specific performance statistics directly from service invocations of applications.
Whether you are tuning service components for optimal efficiency or diagnosing a poor performance, it is important to understand how the various run time and application resources are behaving from a performance perspective. The Performance Monitoring Infrastructure (PMI) provides a comprehensive set of data that explains the runtime and application resource behavior. Using PMI data, the performance bottlenecks in the application server can be identified and fixed. PMI data can also be used to monitor the health of servers.
The PMI is included in the base WebSphere Application Server installation. This section provides only supplemental information about performance monitoring as it relates to the service components specific to IBM Business Process Manager; therefore, consult the information in the WebSphere Application Server documentation for using PMI with other parts of the entire product.
The service component event points specific to IBM Business Process Manager that can be monitored by the PMI are those events that include ENTRY, EXIT, and FAILURE event natures. Event sources which are not defined according to this pattern are not supported. Events that are supported have three types of performance statistics that can be measured:
- Successful invocations.
- Failed invocations.
- Elapsed time for event completion.
You can also monitor performance statistics derived from the service invocations of applications by using the Application Response Measurement (ARM) statistics. These statistics measure the actual runtime processes that underlie the process server service component events making up an enterprise application. You can derive various performance measurements for the processing of applications using these statistics.
- Performance Monitoring Infrastructure statistics You can monitor three types of performance statistics using the Performance Monitoring Infrastructure: the number of successful invocations, the number of failures, and the elapsed time to completion of an event. These statistics are only available for events that have event natures of type ENTRY, EXIT, and FAILURE.
- Application Response Measurement statistics for the Service Component Architecture There are 25 performance statistics that you can monitor at the Service Component Architecture (SCA) level. You can use these Application Response Measurement (ARM) statistics, which are either counters or timers, to measure invocations to and responses from services in various patterns.
Related concepts:
Related tasks:
View performance metrics with the Tivoli Performance Viewer
"Monitoring" in the WAS information center
Performance Monitoring Infrastructure statistics
You can monitor three types of performance statistics using the Performance Monitoring Infrastructure: the number of successful invocations, the number of failures, and the elapsed time to completion of an event. These statistics are only available for events that have event natures of type ENTRY, EXIT, and FAILURE.
- Enable PMI using the administrative console To monitor performance data you must first enable the Performance Monitoring Infrastructure on the server.
- Event performance statistics Performance monitoring statistics are available for most server events. You can use performance monitoring statistics to monitor the counts of successful and unsuccessful invocation requests, and the time taken to complete events.
- Specifying performance statistics to monitor You can specify single statistics, multiple statistics, or groups of related statistics for monitoring through the Performance Monitoring Infrastructure by using the administrative console.
- Tutorial: Service component performance monitoring This tutorial guides you through an example of setting up performance monitoring, and how to view the resulting statistics.
Related concepts:
Related reference:
Service Component Architecture events
Enable PMI using the administrative console
To monitor performance data you must first enable the Performance Monitoring Infrastructure on the server. You can enable the Performance Monitoring Infrastructure (PMI) through the administrative console.
- Open the administrative console.
- Click Monitoring and Tuning > Performance Monitoring Infrastructure (PMI) > server_name in the console navigation tree.
- Select the Enable Performance Monitoring Infrastructure (PMI) check box.
- Optional: Select the check box for Use sequential counter updates to enable precise statistic updates.
- Go back to the server PMI configuration page by clicking the server name link.
- Click Apply or OK.
- Click Save.
- Restart the server.
The changes you make will not take effect until you restart the server.
Tutorial: Service component performance monitoring
Event performance statistics
Performance monitoring statistics are available for most server events. You can use performance monitoring statistics to monitor the counts of successful and unsuccessful invocation requests, and the time taken to complete events.
You can use the Performance Monitoring Infrastructure (PMI) to monitor three performance statistics generated by certain server events, as shown in the following table:
| Statistic name | Type | Description |
|---|---|---|
| BadRequests | Counter | Number of failed invocations of the event. |
| GoodRequests | Counter | Number of successful invocations of the event. |
| ResponseTime | Timer | Elapsed time for event completion. |
These statistics are limited to service component events with elements having ENTRY, EXIT, and FAILURE natures. Each statistic is created for a single event of a given server event type in an application. All performance measurements are either counters (a cumulative number of the firings of a given event point), or timers (the duration, measured in milliseconds, between the firings of two event points). Each event kind (and their relevant elements) that can be monitored are listed in Table 2:
| Event type | Element(s) |
|---|---|
| Business process | ProcessInvokeStaffReceiveWaitCompensatePickScope |
| Human task | Task |
| Business rule | Operation |
| Business state machine | TransitionGuardActionEntryActionExitAction |
| Selector | Operation |
| Map | MapTransformation |
| Mediation | OperationBindingParameterMediation |
| Resource adapter | InboundEventRetrievalInboundEventDeliveryOutbound |
Related reference:
Application Response Measurement statistics for the Service Component Architecture
Specifying performance statistics to monitor
You can specify single statistics, multiple statistics, or groups of related statistics for monitoring through the Performance Monitoring Infrastructure by using the administrative console.
Ensure that you have enabled performance monitoring, and that you have at least once invoked the event you want to monitor before performing this task.
- Open the administrative console.
- Select Monitoring and Tuning > Performance Monitoring Infrastructure.
- Select the server or node agent that contains the event points to monitor.
You cannot choose to monitor statistics on a cluster; you can only do so on a specific server or node.
- Expand some of the groups, such as WBIStats.RootGroup or Enterprise Beans. All the statistics that can be monitored are in the listed groups. Some statistics cannot be listed because they have not been invoked since the server was last started.
- Select a statistic you want to monitor from the tree, and then select the statistics to collect. Then click Enable. Repeat for all statistics to monitor.
- Go back to the server PMI configuration page by clicking the server name link.
- Click Apply or OK.
- Click Save.
You can now start monitoring the performance of your chosen statistics in the Tivoli Performance Viewer.
When viewing these statistics, Do not mix counter-type statistics with duration-type statistics. Counters are cumulative, and the scales against which they are graphed them can quickly grow depending on your application. Duration statistics, in contrast, tend to remain within a certain range because they represent the average amount of time that it takes your system to process each event. Consequently, the disparity between the statistics and their relative scales can cause one or the other type of statistic to appear skewed in the viewer graph.
Related tasks:
View performance metrics with the Tivoli Performance Viewer
Tutorial: Service component performance monitoring
This tutorial guides you through an example of setting up performance monitoring, and how to view the resulting statistics.
For service component event points that you monitor, you can publish to the Performance Monitoring Infrastructure (PMI) and view the resulting performance statistics on the Tivoli Performance Viewer (TPV). This exercise demonstrates how performance monitoring of service component event points differs from monitoring using the Common Event Infrastructure (CEI) server and loggers. The major difference that you notice is that you select an entire service component element for performance monitoring, instead of individual events with specific natures. Because IBM Business Process Manager can monitor performance only on service component elements having events with ENTRY, EXIT, and FAILURE natures, you have only those kinds of service component elements available to you to select for monitoring.
While the service component event points ENTRY, EXIT, and FAILURE are identical for all monitoring types, the performance monitoring function in the server fires "minimized" events that do not contain all the information encompassed in CEI events. These events are sent to the PMI, which calculates these performance statistics from corresponding sets of events:
- Successful invocation - the firing of an event of nature type EXIT that follows a corresponding ENTRY event.
- Failed invocation - the firing of an event with a FAILURE nature following a corresponding ENTRY event.
- Time for successful completion - the elapsed time between the firing an ENTRY event and the firing of the corresponding EXIT event point.
The PMI publishes the statistics to the TPV, which presents cumulative counters for the number of successful and failed invocations and a running average of the completion response times.
Objectives of this tutorial
After completing this tutorial, you will be able to:
- Select the performance statistics of service component elements to monitor.
- View and interpret the resulting performance statistics.
Time required to complete this tutorial
This tutorial requires approximately 15-20 minutes to complete.
Prerequisites
In order to perform this tutorial, you must have:
- Configured and started a server.
- Enabled the PMI on the server.
- Installed and started the Samples Gallery application on the server.
- Installed and started the business rules sample application on the server. Follow the instructions on the Samples Gallery page to set up and run the business rules sample application.
After all these prerequisites have been completed, run the business rules sample application from the Samples Gallery at least once before proceeding with the tutorial.
- Example: Monitoring service component performance For monitoring performance, you can use the administrative console to select service components for monitoring and view performance measurements. This example shows the use of the console to monitor performance statistics.
Related tasks:
Install and accessing the Samples Gallery
Enable PMI using the administrative console
View performance metrics with the Tivoli Performance Viewer
Example: Monitoring service component performance
For monitoring performance, you can use the administrative console to select service components for monitoring and view performance measurements. This example shows the use of the console to monitor performance statistics.
You will use the business rules sample application for this scenario, where you will monitor all three of the performance statistics: successes, failures, and response times. You should have the web page containing this application already open; keep it open, because you will be running the sample several times after you begin monitoring. Ensure that you have already run the sample at least once, which causes it to appear in the list of functions that you can select to monitor.
- Open the administrative console.
- Select the cluster or server to monitor.
- To monitor a cluster, click Servers > Clusters > WebSphere application server clusters > cluster_name.
- To monitor a single server, click Servers > Server Types > WebSphere application servers > server_name.
- Click the Runtime tab.
- Under Performance, click Performance Monitoring Infrastructure.
- Select Custom.
- Expand WBIStats.RootGroup > BR > brsample_module.DiscountRuleGroup > Operation.
- Select _calculateDiscount
- Select the check boxes next to BadRequests, GoodRequests, and ResponseTime.
- Click Enable
- In the navigation pane, click Monitoring and Tuning > Performance Viewer > Current Activity.
- Select the check box next to server_name, then click Start Monitoring.
- Click server_name.
- Expand WBIStats.RootGroup > BR > brsample_module.DiscountRuleGroup > Operation.
- Select the check box next to _calculateDiscount
You should now see a blank graph, and underneath the names and values for the three statistics. Select the check boxes next to the statistic names, if they are not already checked. The PMI is now ready to publish performance data for the selected event, and the Tivoli Performance Viewer is ready to present the results.
Run the business rules sample application several times, and then watch the performance viewer as it periodically refreshes. Notice there are now lines on the graph, representing the cumulative number of successful requests and the average response time for each successful request. You can also see the values next to the name for each statistic below the graph. The line for the number of successes should continue to rise as you perform additional invocations of the sample, while the response time line should level off after a few refreshes.
After you have completed this example, you should understand how IBM Business Process Manager implements performance monitoring of service components. You should know how to select service components for monitoring, and how the performance statistics are calculated. You will also be able to start the performance monitors, and view the performance measurements for applications as they are being used.
Performance monitoring can tax system resources; therefore,
after you have completed this task you should stop the monitors. To do this, click the Tivoli Performance Viewer link, select both the node and the server and press Stop Monitoring.
Application Response Measurement statistics for the Service Component Architecture
There are 25 performance statistics that you can monitor at the Service Component Architecture (SCA) level. You can use these Application Response Measurement (ARM) statistics, which are either counters or timers, to measure invocations to and responses from services in various patterns.
The Application Response Measurement (ARM) statistics shown in the following tables are - in a simplified manner - time and count measurements of caller invocations to the Service Component Architecture (SCA) layer, and the results returned from a service. There are, in fact, a number of service invocation patterns that vary between synchronous and asynchronous implementations of deferred responses, results retrievals, callbacks, and one-way invocations. All patterns, however, are between the caller invocation and a service, the response from the service, or, in some cases, a data source, with the SCA layer interposed in between.
You can specify the ARM statistics to monitor by opening the Monitoring and Tuning > Request Metrics panel on the administrative console. Request metrics information might be either saved to the log file for later retrieval and analysis, be sent to ARM agents, or both. BPM does not ship an ARM agent; however, it supports the use of agents adhering to ARM 4.0. You can choose your own ARM implementation provider to obtain the ARM implementation libraries. Follow the instructions from the ARM provider, and ensure the ARM API Java™ archive (JAR) files found in the ARM provider are on the class path so that IBM Business Process Manager can load the needed classes. Then you need to add the following entries into the system properties for each server by selecting from the administrative console Application servers > server_name > Process Definition > Java Virtual Machine > Custom Properties before restarting the server:
- Arm40.ArmMetricFactory - the full Java class name of your ARM implementation providers metrics factory.
- Arm40.ArmTranReportFactory - the full Java class name of your ARM implementation providers transaction report factory.
- Arm40.ArmTransactionFactory - the full Java class name of your ARM implementation providers transaction factory.
See the WebSphere Application Server documentation for further details on how to configure the server to collect ARM statistics.
| >Event type | >Element |
|---|---|
| Business process | Process |
| Human task | Task |
| Business rule | Operation |
| Business state machine | TransitionGuardActionEntryActionExitAction |
| Selector | Operation |
| Map | MapTransformation |
| Mediation | OperationBindingParameterMediation |
| Resource adapter | InboundEventRetrievalInboundEventDeliveryOutbound |
| Statistic name | Type | Description |
|---|---|---|
| GoodRequests | Counter | Number of server invocations not raising exceptions. |
| BadRequests | Counter | Number of server invocations raising exceptions. |
| ResponseTime | Timer | Duration measured on the server side between the reception of a request and computing the result. |
| TotalResponseTime | Timer | Duration measured on the caller side, from the time a caller requests a service to the time when the result is available for the caller. Does not include the processing of the result by the caller. |
| RequestDeliveryTime | Timer | Duration measured on the caller side, from the time a caller requests a service to the time when the request is handed over to the implementation on the server side. In a distributed environment, the quality of this measurement depends on the quality of synchronization of system clocks. |
| ResponseDeliveryTime | Timer | The time required to make the result available to the client. For a deferred response, this time does not include the result retrieve time. In a distributed environment, the quality of this measurement depends on the quality of synchronization of system clocks. |
| Statistic name | Type | Description |
|---|---|---|
| GoodRefRequests | Counter | Number of caller invocations to the SCA layer that do not raise exceptions. |
| BadRefRequests | Counter | Number of caller invocations to the SCA layer that do raise exceptions. |
| RefResponseTime | Timer | Duration measured on the caller side, from the time the caller makes a request to the SCA layer and the time when the results of that call are returned to the caller. |
| BadRetrieveResult | Counter | Number of caller invocations to a data source that do raise exceptions. |
| GoodRetrieveResult | Counter | Number of caller invocations to a data source that do not raise exceptions. |
| RetrieveResultResponseTime | Timer | Duration measured on the caller side, from the time the caller makes a request to the data source and the time when the data source response is returned to the caller. |
| RetrieveResultWaitTime | Timer | Duration measured on the caller side if a timeout occurs. |
| Statistic name | Type | Description |
|---|---|---|
| GoodTargetSubmit | Counter | Number of SCA invocations to the service that do not raise exceptions. |
| BadTargetSubmit | Counter | Number of SCA invocations to the service that do raise exceptions. |
| TargetSubmitTime | Timer | Duration measured on the server side, from the time the SCA makes a request to the service and the time when the results of that call are returned to the SCA. |
| GoodResultSubmit | Counter | Number of service invocations to the data source that do not raise exceptions. |
| BadResultSubmit | Counter | Number of service invocations to the data source that do raise exceptions. |
| ResultSubmitTime | Timer | Duration measured on the server side, from the time the service makes a request to the data source and the time when the results of are returned to the service. |
| Statistic name | Type | Description |
|---|---|---|
| GoodCB | Counter | Number of SCA invocations to the callback that do not raise exceptions. |
| BadCB | Counter | Number of SCA invocations to the callback that do raise exceptions. |
| CBTime | Timer | Duration from the time the SCA makes a request to the callback, and the time when the results from the callback are returned to the SCA. |
| GoodCBSubmit | Counter | Number of invocations from the service to the SCA handling the callback that do not raise exceptions. |
| BadCBSubmit | Counter | Number of invocations from the service to the SCA handling the callback that do raise exceptions. |
| CBSubmitTime | Timer | Duration from the time the service makes a request to the SCA handling the callback, and the time when the results from the SCA to the service. |
Synchronous invocations
You can obtain Application Response Measurement (ARM) performance statistics from a simple Service Component Architecture (SCA) call to a service and the response from the service.
Parameters
Event monitoring for SCA components includes the event points that are shown in black  , while the event points shown in blue
  are used only to calculate and fire PMI/ARM statistics.
In Table 1 and Figure 1, the "current" ARM transaction (denoted as X1) is created when the calling service component was invoked for the first time. If the caller is not a service component, the current ARM transaction is used, or a new one is created. If it is not the starting transaction then it has a parent, as represented in the following table and diagram with the notation Xn.Xn+1. The notation is used to document the transaction lineage. Every SCA invocation starts a new transaction, which is parented by the current transaction of the caller. You can create new transactions and you can access the current transaction, but they do not modify the SCA transaction lineage.
| Statistics | Formula | ARM Transaction |
|---|---|---|
| TotalResponseTime | t3 - t0 | X0 .X1 |
| RequestDeliveryTime | t1 - t0 | X1 .X2 |
| ResponseDeliveryTime | t3 - t2 | |
| GoodRequests | CountEXIT | |
| BadRequests | CountFAILURE | |
| ProcessTime | t2 - t1 |
Figure 1. ARM statistics obtained from an SCA call with a synchronous implementation

Deferred response with synchronous implementation
You can obtain Application Response Measurement (ARM) statistics with a synchronous invocation of the request. The returned result is sent as output to a data store for a synchronous implementation.
Parameters
Event monitoring for Service Component Architecture (SCA) components includes the event points that are shown in black , while the event points shown in blue are used only to calculate and fire PMI/ARM statistics.
In Table 1 and Figure 1, the "current" ARM transaction (denoted as X1) is created when the calling service component was invoked for the first time. If the caller is not a service component, the current ARM transaction is used, or a new one is created. If it is not the starting transaction, it has a parent, as represented in the following table and diagram with the notation Xn.Xn+1. The notation is used to show the transaction lineage. Every SCA invocation starts a new transaction, which is parented by the current transaction of the caller. You can create new transactions and you can access the current transaction, but you cannot modify the SCA transaction lineage.
| Type | Statistics | Formula | ARM Transaction |
|---|---|---|---|
| Common | TotalResponseTime | t3 - t0 | X0.X1 |
| RequestDeliveryTime | t'0 - t0 | X1.X2 | |
| ResponseDeliveryTime | N/A | N/A | |
| GoodRequests | CountEXIT | X1.X2 | |
| BadRequests | CountFAILURE | ||
| ResponseTime | t'1 - t'0 | ||
| Reference A | GoodRefRequest | CountEXIT | X1.X2 |
| BadRefRequests | CountFAILURE | ||
| RefResponseTime | t1 - t0 |
Figure 1. Graphic representation of a deferred response with synchronous implementation

| >Type | >Statistics | >Formula | >ARM Transaction |
|---|---|---|---|
| Reference B | GoodRetrieveResult | CountEXIT | X1.X2 |
| BadRetrieveResult | CountFAILURE | ||
| ResultRetrieveResponseTime | Σ t3 - t2 | ||
| ResultRetrieveWaitTime | Σ timeout |
Deferred response with asynchronous implementation
You can obtain Application Response Measurement (ARM) statistics from an asynchronous implementation. The call to the service and the return result are invoked but the resulting output is sent to a data store from the service target.
Parameters
Event monitoring for Service Component Architecture (SCA) components includes the event points that are shown in black , while the event points shown in blue are used only to calculate and fire PMI/ARM statistics.
In the table and diagram below, the "current" ARM transaction (denoted as X1) is created when the calling service component was invoked for the first time. If the caller is not a service component, the current ARM transaction is used, or a new one is created. If it is not the starting transaction, it has a parent, as represented in the following table and diagram with the notation Xn.Xn+1. The notation is used to show the transaction lineage. Every SCA invocation starts a new transaction, which is parented by the current transaction of the caller. You can create new transactions and you can access the current transaction, but you cannot modify the SCA transaction lineage.
| Type | Statistics | Formula | ARM Transaction |
|---|---|---|---|
| Common | TotalResponseTime | t3 - t0 | X0.X1 |
| RequestDeliveryTime | t'0 - t0 | X1.X2 | |
| ResponseDeliveryTime | t'03 - t'2 | ||
| GoodRequests | CountEXIT | ||
| BadRequests | CountFAILURE | ||
| ResponseTime | t'3 - t'0 | ||
| Reference A | GoodRefRequest | CountEXIT | X0.X1 |
| BadRefRequests | CountFAILURE | ||
| RefResponseTime | t1 - t0 | ||
| Target A | GoodTargetSubmit | CountEXIT | X1.X2 |
| BadTargetSubmit | CountFAILURE | ||
| TargetSubmitTime | t'1 - t'0 |

| >Type | >Statistics | >Formula | >ARM Transaction |
|---|---|---|---|
| Reference B | GoodResultSubmit | CountEXIT | X0.X1 |
| BadResultSubmit | CountFAILURE | ||
| ResultResponseTime | t'3 - t'2 | ||
| Target B | GoodResultRetrieve | CountEXIT | X1.X2 |
| BadResultRetrieve | CountFAILURE | ||
| ResultRetrieveResponseTime | Σ t3 - t2 | ||
| ResultRetrieveWaitTime | Σ timeout |
Deferred response with asynchronous result retrieve
The ResultRetrieve Application Response Measurement (ARM) statistic can be correlated to some original request using the ARM transactions only if XPARENT-1 and XPARENT-2 have a common ancestor transaction. The invocation of request, and result retrieve occur on different threads
Parameters
Event monitoring for Service Component Architecture (SCA) components includes the event points that are shown in black , while the event points shown in blue are used only to calculate and fire PMI/ARM statistics.
In Table 1 and Figure 1, the "current" ARM transaction (denoted as X1) is created when the calling service component was invoked for the first time. If the caller is not a service component, the current ARM transaction will be used, or a new one will be created. If it is not the starting transaction it will have a parent. This is represented in the following table and diagram with the notation Xn.Xn+1. These are used to show the transaction lineage. Every SCA invocation starts a new transaction, which is parented by the current transaction of the caller. You can create new transactions and you can access the current transaction, but this will not modify the SCA transaction lineage.
| Type | Statistics | Formula | ARM Transaction |
|---|---|---|---|
| Common | TotalResponseTime | t3 - t0 | X0.X1 |
| RequestDeliveryTime | t'0 - t0 | X1.X2 | |
| ResponseDeliveryTime | N/A | N/A | |
| GoodRequests | CountEXIT | X1.X2 | |
| BadRequests | CountFAILURE | ||
| ResponseTime | See specific diagrams | ||
| Reference A | GoodReferenceRequest | CountEXIT | X1.X2 |
| BadReferenceRequests | CountFAILURE | ||
| ReferenceResponseTime | t1 - t0 |
Figure 1. A deferred response with an asynchronous result retrieve

| >Type | >Statistics | >Formula | >ARM Transaction |
|---|---|---|---|
| Reference B | GoodRetrieveResult | CountEXIT | X'0.X'1 |
| BadRetrieveResult | CountFAILURE | ||
| RetrieveResultResponseTime | Σ t3 - t2 | ||
| RetrieveResultWaitTime | Σ timeout |
Asynchronous callback with synchronous implementation
You can obtain Application Response Measurement (ARM) statistics when callback requests and callback executions use different threads on a synchronous implementation.
Parameters
Event monitoring for Service Component Architecture (SCA) components includes the event points that are shown in black , while the event points shown in blue are used only to calculate and fire PMI/ARM statistics.
In Table 1 and Figure 1, the "current" ARM transaction (denoted as X1) is created when the calling service component was invoked for the first time. If the caller is not a service component, the current ARM transaction is used, or a new one is created. If it is not the starting transaction, it has a parent, as represented in the following table and diagram with the notation Xn.Xn+1. The notation is used to show the transaction lineage. Every SCA invocation starts a new transaction, which is parented by the current transaction of the caller. You can create new transactions and you can access the current transaction, but you cannot modify the SCA transaction lineage.
| Type | Statistics | Formula | ARM Transaction |
|---|---|---|---|
| Common | TotalResponseTime | t2 - t0 | X0.X1 |
| RequestDeliveryTime | t'0 - t0 | X1.X2 | |
| ResponseDeliveryTime | t2 - t'1 | ||
| GoodRequests | CountEXIT | ||
| BadRequests | CountFAILURE | ||
| ResponseTime | t3 - t2 | ||
| Reference | GoodRefRequest | CountEXIT | X1.X2 |
| BadRefRequests | CountFAILURE | ||
| RefResponseTime | t'1 - t'0 |
Figure 1. Diagram of an asynchronous callback with a synchronous implementation

| >Type | >Statistics | >Formula | >ARM Transaction |
|---|---|---|---|
| Callback | GoodCB | CountEXIT | X1.X3 |
| BadCB | CountFAILURE | ||
| CBTime | t3 - t2 |
Asynchronous callback with asynchronous implementation
Application Response Measurement (ARM) statistics are available for callback requests and callback executions using different threads with an asynchronous implementation
Parameters
Event monitoring for Service Component Architecture (SCA) components includes the event points that are shown in black , while the event points shown in blue are used only to calculate and fire PMI/ARM statistics.
In Table 1 and Figure 1, the "current" ARM transaction (denoted as X1) is created when the calling service component was invoked for the first time. If the caller is not a service component, the current ARM transaction is used, or a new one is created. If it is not the starting transaction it has a parent, as represented in the following table and diagram with the notation Xn.Xn+1. The notation is used to show the transaction lineage. Every SCA invocation starts a new transaction, which is parented by the current transaction of the caller. You can create new transactions and you can access the current transaction, but you cannot modify the SCA transaction lineage.
| Type | Statistics | Formula | ARM Transaction |
|---|---|---|---|
| Common | TotalResponseTime | t2 - t0 | X0.X1 |
| RequestDeliveryTime | t'0 - t0 | X1.X2 | |
| ResponseDeliveryTime | t2 - t'2 | ||
| GoodRequests | CountEXIT | ||
| BadRequests | CountFAILURE | ||
| ResponseTime | t'3 - t'0 | ||
| Reference A | GoodRefRequest | CountEXIT | X0.X1 |
| BadRefRequests | CountFAILURE | ||
| RefResponseTime | t1 - t0 | ||
| Target A | GoodTargetSubmit | CountEXIT | X1.X2 |
| BadTargetSubmit | CountFAILURE | ||
| TargetSubmitTime | t'1 - t'0 |
Figure 1. An asynchronous callback with an asynchronous implementation

| >Type | >Statistics | >Formula | >ARM Transaction |
|---|---|---|---|
| Reference B | GoodCBSubmit | CountEXIT | X1.X2 |
| BadCBSubmit | CountFAILURE | ||
| CBSubmitTime | t'3 - t'2 | ||
| Target B | GoodCB | CountEXIT | X0.X1 |
| BadCB | CountFAILURE | ||
| CBTime | t3 - t2 |
Asynchronous one way with synchronous implementation
These Application Response Measurement (ARM) statistics can be obtained when a call is submitted (fire and forget) with a synchronous implementation.
Parameters
Event monitoring for Service Component Architecture (SCA) components includes the event points that are shown in black , while the event points shown in blue are used only to calculate and fire PMI/ARM statistics.
In Table 1 and Figure 1, the "current" ARM transaction (denoted as X1) is created when the calling service component was invoked for the first time. If the caller is not a service component, the current ARM transaction is used, or a new one is created. If it is not the starting transaction, it has a parent, as represented in the following table and diagram with the notation Xn.Xn+1. The notation is used to show the transaction lineage. Every SCA invocation starts a new transaction, which is parented by the current transaction of the caller. You can create new transactions and you can access the current transaction, but you cannot modify the SCA transaction lineage.
| Type | Statistics | Formula | ARM Transaction |
|---|---|---|---|
| Common | TotalResponseTime | t1 - t0 | X0.X1 |
| RequestDeliveryTime | t'0 - t0 | X1.X2 | |
| ResponseDeliveryTime | N/A | N/A | |
| GoodRequests | CountEXIT | X1.X2 | |
| BadRequests | CountFAILURE | ||
| ResponseTime | t'1 - t'0 |
Figure 1. Diagram of asynchronous one-way call with a synchronous implementation

Asynchronous one way with asynchronous implementation
Application Response Measurement (ARM) statistics when a call is submitted (fire and forget) with an asynchronous implementation.
Parameters
Event monitoring for Service Component Architecture (SCA) components includes the event points that are shown in black , while the event points shown in blue are used only to calculate and fire PMI/ARM statistics.
In Table 1 and in Figure 1, the "current" ARM transaction (denoted as X1) is created when the calling service component was invoked for the first time. If the caller is not a service component, the current ARM transaction is used, or a new one is created. If it is not the starting transaction, it has a parent. This relationship is represented in the following table and diagram with the notation Xn.Xn+1. The notation is used to show the transaction lineage. Every SCA invocation starts a new transaction, which is parented by the current transaction of the caller. You can create new transactions and you can access the current transaction, but you cannot modify the SCA transaction lineage.
| Type | Statistics | Formula | ARM Transaction |
|---|---|---|---|
| Common | TotalResponseTime | t1 - t0 | X0.X1 |
| RequestDeliveryTime | t'0 - t0 | X1.X2 | |
| ResponseDeliveryTime | N/A | N/A | |
| GoodRequests | CountEXIT | X1.X2 | |
| BadRequests | CountFAILURE | ||
| ResponseTime | t2 - t0 | ||
| Reference | GoodRefRequest | CountEXIT | X0.X1 |
| BadRefRequest | CountFAILURE | ||
| RefResponseDuration | t1 - t0 |
Figure 1. An asynchronous one-way call with an asynchronous implementation
Monitor service component events
IBM Business Process Manager monitoring can capture the data in a service component at a certain event point. You can view each event in a log file, or you can use the more versatile monitoring capabilities of a Common Event Infrastructure server.
Applications deployed on the process server may contain a specification of service component events that will be monitored for as long as the application runs. If you developed the application using the WebSphere Integration Developer, then you can specify service component events to monitor continuously. This specification is included as part of the application, and comes in the form of file with a .mon extension that is read by the process server when the application is deployed. After the application is started, you will not be able to turn off monitoring of the service components specified in the .mon file. The documentation for the BPM does not address this type of continuous monitoring. For more information about this subject, refer to the Integration Designer documentation.
You can use IBM Business Process Manager to monitor service component events not already specified in the .mon file of the application. You can configure the process server to direct the output of the event monitors to a log file, or to a Common Event Infrastructure server database. The monitored events will be formatted using the Common Base Event standard, but you can regulate the amount of information contained in each event. Use the monitoring facilities in BPM to diagnose problems, analyze the process flow of applications, or audit how applications are used.
- Enable monitoring of business process and human task events Configure IBM Business Process Manager to support monitoring of business process and human task service components before you do any actual monitoring of those service component kinds.
- Configure logging for service component events You can choose to use the logging facilities of WebSphere Application Server to capture the service component events fired by process server monitoring. Use the loggers to view the data in events when you diagnose problems with the processing of applications.
Related concepts:
Enable monitoring of business process and human task events
Configure IBM Business Process Manager to support monitoring of business process and human task service components before you do any actual monitoring of those service component kinds.
You created a BPM Advanced environment, which includes a Business Process Choreographer configuration.
Perform this task to enable Common Event Infrastructure monitoring support.
- Open the administrative console.
- To enable business process events for the Human Task Manager, click Servers > Clusters > WebSphere application server clusters > cluster_name, then on the Configuration tab under Business Process Manager, expand Business Process Choreographer, ensure the boxes for Enable Common Event Infrastructure Logging, Enable audit logging, and Enable task history are selected. If the check boxes are not selected, then you must select them and restart the server.
- To enable business process events for the Business Flow Manager, click Servers > Clusters > WebSphere application server clusters > cluster_name, then on the Configuration tab under Business Process Manager, expand Business Process Choreographer, click Business Flow Manager.
In the section State Observers, ensure the boxes for Enable Common Event Infrastructure Logging and Enable audit logging are selected. If the check boxes are not selected, then you must select them and restart the server.
- If you had to select any of the boxes, then you must restart the cluster for the changes to take effect.
Related tasks:
Enable the diagnostic trace service
Configuring Business Process Choreographer: 

Configure logging for service component events
You can choose to use the logging facilities of WebSphere Application Server to capture the service component events fired by process server monitoring. Use the loggers to view the data in events when you diagnose problems with the processing of applications.
IBM Business Process Manager uses the extensive logging facilities of the underlying WebSphere Application Server to allow you to capture the events fired by server monitoring at service component event points. You can use the administrative console to specify the particular service component event points to monitor, the amount of payload detail contained in the resulting service component events, and the method used to publish the results, such as to a file of a certain format, or directly to a console. Monitor logs contain events encoded in Common Base Event format, and you can use the information contained in the event elements to trace problems with the processing of your service components.
The functionality of WebSphere Application Server logging and tracing capabilities is documented in considerable detail in the WebSphere Application Server documentation, with complete details of how logging and tracing is used within the entire product. This section provides only supplemental information about logging as it relates to the service components that are specific to IBM Business Process Manager. Consult the information in the WebSphere Application Server documentation for using logging and trace with other components of the entire product.
- Enable the diagnostic trace service Use this task to enable the diagnostic trace service, which is the logging service that can manage the amount of detail contained in the service component event.
- Configure logging properties using the administrative console Use this task to specify the monitoring function publish service component events to a logger file.
- Tutorial: Logging service component events For service component event points that you monitor, events can be published to the logging facilities of the underlying WAS. This tutorial guides you through an example of setting up monitoring with logging, and how to view events stored in a log file.
- Audit logging for business rules and selectors You can set up IBM Business Process Manager to automatically log any changes made to business rules and selectors.
Related concepts:
View and interpreting service component event log files
 "Adding logging and tracing to your application" in the WAS information center
Enable the diagnostic trace service
Use this task to enable the diagnostic trace service, which is the logging service that can manage the amount of detail contained in the service component event.
You must have the business process and human task containers configured to allow Common Event Infrastructure (CEI) logging and audit logging.
The diagnostic trace service is the only logger type that can provide the level of detail required to capture the detail contained in the elements of service component events. You must enable the diagnostic trace service before starting the process server in order to log events. The service must also be enabled if use the administrative console to select service component event points for monitoring using the CEI server.
- In the navigation pane, click Servers > Server Types > WebSphere application servers.
- Click the name of the server to work with.
- Under Troubleshooting, click Diagnostic Trace service.
- Select Enable log on the Configuration tab.
- Click Apply, and then Save.
- Click OK.
If the server was already started, then you must restart it for the changes to take effect.
Related tasks:
Configure logging properties using the administrative console
Enable monitoring of business process and human task events
Configure logging properties using the administrative console
Use this task to specify the monitoring function publish service component events to a logger file. Before applications can log monitored events, you must specify the service component event points to monitor, what level of detail you require for each event, and format of the output used to publish the events to the logs. Using the administrative console, you can:
- Enable or disable a particular event log.
- Set the level of detail in a log.
- Specify where log files are stored, how many log files are kept, and a format for log output.
You can change the log configuration statically or dynamically. Static configuration changes affect applications when you start or restart the application server. Dynamic or run time configuration changes apply immediately.
When a log is created, the level value for that log is set from the configuration data. If no configuration data is available for a particular log name, the level for that log is obtained from the parent of the log. If no configuration data exists for the parent log, the parent of that log is checked, and so on, up the tree until a log with a non-null level value is found. When you change the level of a log, the change is propagated to the children of the log, which recursively propagates the change to their children, as necessary.
- Enable logging and set the output properties for a log:
- In the navigation pane, click Servers > Server Types > WebSphere application servers.
- Click the name of the server to work with.
- Under Troubleshooting, click Logging and tracing.
- Click Change Log Detail levels.
- The list of components, packages, and groups displays all the components that are currently registered on the running server;
only server events that have been invoked at least once appear on this list. All server components with event points that can be logged are listed under one of the components that start with the name WBILocationMonitor.LOG.
- To select events for a static change to the configuration, click the Configuration tab.
- To select events for a dynamic change to the configuration, click the Runtime tab.
- Select the event or group of events to log.
- Set the logging level for each event or group of events.
Only the levels FINE, FINER, and FINEST are valid for CEI event logging.
- Click Apply.
- Click OK.
- To have static configuration changes take effect, stop then restart the server.
By
default, the loggers publish their output to a file called trace.log, located in the install_root/profiles/profile_name/logs/server_name folder. By default, the loggers publish their output to the job log.
Related concepts:
View and interpreting service component event log files
View and interpreting service component event log files
Related tasks:
Enable the diagnostic trace service
Tutorial: Logging service component events
For service component event points that you monitor, events can be published to the logging facilities of the underlying WebSphere Application Server. This tutorial guides you through an example of setting up monitoring with logging, and how to view events stored in a log file.
The scenario you will follow for this example will show you how to select service component event points for monitoring in applications already deployed and running on a server. You will see how the monitoring function fires an event whenever the processing of an application reaches one of those event points. Each of those fired events takes the form of a standardized Common Base Event, which is published as an XML string directly to a log file.
Objectives of this tutorial
After completing this tutorial you will be able to:
- Select service component event points to monitor, with the output published to the server loggers.
- View the stored events in the log files.
Time required to complete this tutorial
This tutorial requires approximately 15-20 minutes to complete.
Prerequisites
In order to perform this tutorial, you must have:
- Configured and started a server.
- Configured Common Event Infrastructure.
- Enabled the diagnostic trace service on the server.
- Installed and started the Samples Gallery application on the server.
- Installed and started the business rules sample application on the server. Follow the instructions on the Samples Gallery page to set up and run the business rules sample application.
After all of these prerequisites have been completed, run the business rules sample application from the Samples Gallery at least once before proceeding with the tutorial.
- Example: Monitoring events in the logger For monitoring with logging, you can use the administrative console to manage the details for event types. This example shows the use of the console to change the level of detail recorded for some event types and to use a text editor to open the trace.log file to view the information for individual events.
Install and accessing the Samples Gallery
Enable the diagnostic trace service
View and interpreting service component event log files
Example: Monitoring events in the logger
For monitoring with logging, you can use the administrative console to manage the details for event types. This example shows the use of the console to change the level of detail recorded for some event types and to use a text editor to open the trace.log file to view the information for individual events.
You will use the business rules sample application for this scenario, so you should already have the web page containing this application already open. Keep it open, since you will be running the sample after you specify monitoring parameters. Ensure that you have already run the sample at least once, so that it will appear in the list of functions that you can select to monitor.
- Open the administrative console.
- In the navigation pane, click Servers > Application Servers.
- Click server_name.
- Under Troubleshooting, click Logging and tracing
- Click Change Log Detail levels
- Select the Runtime tab.
- Expand the tree for WBILocationMonitor.LOG.BR and you will see seven event types under the WBILocationMonitor.LOG.BR.brsample.* element:
- WBILocationMonitor.LOG.BR.brsample_module.DiscountRuleGroup
- WBILocationMonitor.LOG.BR.brsample_module.DiscountRuleGroup.Operation._calculateDiscount
- WBILocationMonitor.LOG.BR.brsample_module.DiscountRuleGroup.Operation._calculateDiscount.ENTRY
- WBILocationMonitor.LOG.BR.brsample_module.DiscountRuleGroup.Operation._calculateDiscount.EXIT
- WBILocationMonitor.LOG.BR.brsample_module.DiscountRuleGroup.Operation._calculateDiscount.FAILURE
- WBILocationMonitor.LOG.BR.brsample_module.DiscountRuleGroup.Operation._calculateDiscount.SelectionKeyExtracted
- WBILocationMonitor.LOG.BR.brsample_module.DiscountRuleGroup.Operation._calculateDiscount.TargetFound
- Click each of the events and select finest.
- Click OK.
- Switch the business rules sample application page, and run the application once.
- Use a text editor to open the trace.log file located in the profile_root/logs/server_name folder on your system.
You should see lines in the log containing the business rule events fired by the monitor when you ran the sample application. The main thing you will probably notice is the output consists of lengthy, unparsed XML strings conforming to the Common Base Event standard. Examine the ENTRY and EXIT events, and you will see that business object - which was included because you selected the finest level of detail - is encoded in hexadecimal format. Compare this output with events published to the Common Event Infrastructure server, which parses the XML into a readable table and decodes any business object data into a readable format. You may want to go back through this exercise and change the level of detail from finest to fine or finer, and compare the differences between the events.
After completing this exercise, you should understand how to select service component event points for monitoring to the logger. You have seen the events fired in this type monitoring have a standard format, and the results are published as a string in raw XML format directly to a log file. To view the published events, open the log file in a text editor, and decipher the contents of individual events.
If you no longer want to monitor the business rules sample application, you can go back to through the steps outlined here and reset the level of detail for the sample events to info.
Audit logging for business rules and selectors
You can set up IBM Business Process Manager to automatically log any changes made to business rules and selectors.
You can configure your server to automatically detect when changes are made to business rules and selectors, and create an entry in a log file detailing the changes.
You can choose to have the log entries written to either the standard JVM SystemOut.log file, or to a custom audit log file of your choice. Depending on how the changes are made, the process server where each business rule or selector change is made logs the:
- name of the person making the change
- location from where the change request originated
- old business rule or selector object
- new business rule or selector replacing the old object
The log entries are written to the spool. Depending on how the changes are made, the process server where each business rule or selector change is made logs the:
- name of the person making the change
- location from where the change request originated
- old business rule or selector object
- new business rule or selector replacing the old object
The business rule and selector objects are the complete business rule set, decision table, business rule group, or selector for both the business rule or selector that is replaced and the new version which replaced it. You can examine the logs (the audit output cannot be directed to the Common Event Infrastructure database) to determine the changes that were made, by comparing the old and new business rules or selectors. The following scenarios describe the circumstance when logging occurs, if it has been configured, and the contents of the log entry:
| Scenario | Result | Log entry contents |
|---|---|---|
| Publish business rules using the Business Rule Manager | Request | User ID, Server name (including Cell and Node, if applicable), old business rule ruleset, new ruleset. |
| Failure | User ID, Server name (including Cell and Node, if applicable), old business rule ruleset, new ruleset. | |
| Repository database update and commit (from attempt to publish using the Business Rule Manager) | Success | User ID, old ruleset, new ruleset. |
| Failure | User ID, new ruleset. | |
| Export a selector or business rule group | Request | User ID, selector, or business rule group name. |
| Success | User ID, Server name (including Cell and Node, if applicable), copy of exported selector or business rule group | |
| Failure | User ID, Server name (including Cell and Node, if applicable), selector or business rule group name. | |
| Import a selector or business rule group | Request | User ID, copy of new selector or business rule group. |
| Success | User ID, Server name (including Cell and Node, if applicable), copy of imported selector or business rule group, copy of selector or business rule group that was replaced by the imported version. | |
| Failure | User ID, Server name (including Cell and Node, if applicable), copy of selector or business rule group that was to be imported. | |
| Application installation | Success | User ID, Server name (including Cell and Node, if applicable), selector or business rule group name. |
| Failure | User ID, Server name (including Cell and Node, if applicable), selector or business rule group name. | |
| Application update (through the administrative console or wsadmin command) | Success | User ID, Server name (including Cell and Node, if applicable), copy of new selector or business rule group, copy of old selector or business rule group. |
| Failure | User ID, Server name (including Cell and Node, if applicable), copy of new selector or business rule group | |
| Previously deployed application with existing business rules, selectors or both is started | Success | Server name (including Cell and Node, if applicable), copy of selector or business rule group. |
| Failure | Server name (including Cell and Node, if applicable), copy of selector or business rule group. |
Related concepts:
Business process rules manager
Administer business rules and selectors
View and interpreting service component event log files
Related tasks:
Configure business rules and selectors auditing using the administrative console
Service Monitoring with Business Space
Service monitoring measures the response time and request throughput for services invoked by and exposed by an SCA module. You choose what operations to monitor on the services exposed to requestors (SCA exports) and consumed (SCA imports), and can optionally define thresholds for response time and throughput.
Service monitoring is available for Process Server and Enterprise Service Bus from the Service Monitor widget in Business Space. Use service monitoring to gather and analyze response time and throughput metrics so you can answer questions like the following:
- How much time do specific services require?
- Does service duration degrade over time?
- How often are specific services called?
- Does throughput adhere to expectations you have defined, or does it degrade over time?
- Do any of the calls exceed a defined threshold?
The information it provides helps you monitor ongoing problems and pinpoint which part of your solution is not responding as expected.
The service monitor plots response time and throughput data on graphs, visually distinguishing those calls that exceed any threshold you have defined. The graphs always show the latest monitoring statistics; however, you can see historical data by increasing the length of time shown on the graphs.
Response time
The Response Time graph indicates the time elapsed between a service request and response. (For service operations with two-way asynchronous implementations, the graph indicates only the time the operation needed to handle the request, not the time that elapsed between request and response.) Response time on the graph is plotted over seconds or minutes; in addition, the Statistic Measurements Table shows you response times for the last second or minute and for the entire monitoring session.
Throughput
The Throughput graph shows how many calls have been completed over a unit of time (seconds or minutes). In addition, the Statistic Measurements Table shows you throughput for the last second or minute and for the entire monitoring session.
Service monitoring architecture
The service monitor performs all service monitoring tasks. It has a client/server architecture:
- Service monitor server
- The service monitor server gathers and aggregates response time and throughput measurements from all running service monitor agents, and then calculates and stores the statistics. The Service Monitor widget queries the server for these measurements.
- Service monitor agent
- The agent measures the throughput and response time for operations and sends the measurement data to the service monitor server.


Service monitoring data is stored in memory. When the buffer is full, the oldest data is discarded and replaced by the newest data. The stored data for an operation is automatically removed when all users turn off monitoring for that operation.
- Monitor services Use the Service Monitor widget to monitor the throughput and response times for service operations exposed or invoked by a running module that is deployed to the server or cluster configured for use with the widget.
Monitor services
Use the Service Monitor widget to monitor the throughput and response times for service operations exposed or invoked by a running module that is deployed to the server or cluster configured for use with the widget.
- Ensure service monitoring is configured and enabled. By default, service monitoring is enabled for servers or clusters created as part of deployment environment and stand-alone server profiles. If you have created a new server with the administrative console, however, configure and enable the service monitor before you can use the Service Monitor widget.
- If you are using an external HTTP server to access Business space, make sure to configure the HTTP server to allow encoded slashes. Refer to the HTTP server documentation for details.
Required security role for this task: If administrative security is enabled, you must be logged in with an administrative role to perform this task.
Perform the following steps to use service monitoring in your business process management solution.
- Log into Business Space and open the Service Monitor widget.
- Configure the general settings for the Service Monitor widget.
- Click Edit Settings from the widget menu, and then select the General Graph Settings tab.
- Review the default general graph configuration and, if necessary, adjust the values.
- Select one or more service operations to monitor.
- By default, selected operations are automatically monitored.
If monitoring has been turned off for an operation, start it by selecting the Monitor On check box.
- Use the graphs and table available in the Service Monitor widget to examine the response time and throughput data for your operations.
- When you are finished monitoring, return to the Monitored Service Operations tab and clear the Monitor On check box next to each operation you want to stop monitoring, and then click OK.
- Selecting service operations to monitor You can monitor the response time, throughput, or both for up to five operations on services exposed or invoked by a module. Use the Service Monitor widget configuration to select the operations you want to monitor and the data you want to plot.
Selecting service operations to monitor
You can monitor the response time, throughput, or both for up to five operations on services exposed or invoked by a module. Use the Service Monitor widget configuration to select the operations you want to monitor and the data you want to plot.
To select service operations to monitor.
- Open the Service Monitor widget and from its widget menu, click Edit Settings.
- Select the Monitored Service Operations tab. The tab lists service operations that are currently being monitored.
- If the operations you want to monitor are not available on the tab, add them.
- Click Add new operation to monitor.
- Select the operation or operations to add to the widget, and then click Add.
- For each selected operation, do the following.
- Optional: Use the Color menu to choose a line color for each operation plotted on the graphs.
- To monitor response times, use the Response Times menu to indicate the statistical measurement you want to plot (maximum, minimum, or mean).
- To monitor throughput for a selected operation, select the Throughput check box.
- Optional: Specify a threshold for response times, throughput, or both in the Threshold fields.
- Click OK to begin plotting data for the selected operations.
View monitored events
There are a number of ways for you to view the published results of your monitored events, depending on the type of monitoring you are using. This section presents methods that you can use to view performance data, event logs, and service component events stored on a Common Event Infrastructure database.
In addition, if you have IBM Business Monitor installed, you can use it to view all recorded events by a specific model. See Manage recorded events for more information.
- View performance metrics with the Tivoli Performance Viewer You can use the Tivoli Performance Viewer to start and stop performance monitoring; view Performance Monitoring Infrastructure data in chart or table form as it occurs on your system; and, optionally, log the data to a file that you can later review in the same viewer.
- View and interpreting service component event log files This topic discusses how you would interpret the information in a log file generated by service component monitoring. You can view the log files in the log viewer on the administrative console, or in a separate text file editor of your choice.
View performance metrics with the Tivoli Performance Viewer
You can use the Tivoli Performance Viewer to start and stop performance monitoring; view Performance Monitoring Infrastructure data in chart or table form as it occurs on your system; and, optionally, log the data to a file that you can later review in the same viewer.
Before you can view performance metrics with the Tivoli Performance Viewer, the following conditions must be true:
- The servers to monitor must be running on the node
- The Performance Monitoring Infrastructure (PMI) is enabled
- The service component event points to monitor have been invoked at least once so they can be selected from within the viewer.
The Tivoli Performance Viewer (TPV) is a powerful application that allows you view various details of about the performance of your server. The section entitled "Monitoring performance with Tivoli Performance Viewer" in the WebSphere Application Server Information Center contains details about how to use this tool for various purposes, including the resource for complete instructions on using this program. This section is limited to discussing the viewing of performance data for events specific to IBM Business Process Manager Advanced.
The performance viewer enables administrators and programmers to monitor the current health of IBM Business Process Manager. Because the collection and viewing of data occurs on the process server, performance is affected. To minimize performance impacts, monitor only those servers whose activity you want to monitor.
When viewing these statistics, do not mix counter-type statistics with duration-type statistics. Counters are cumulative, and the scales against which they are graphed can quickly grow depending on your application. Duration statistics, in contrast, tend to remain within a certain range because they represent the average amount of time that it takes your system to process each event. Consequently, the disparity between the statistics and their relative scales can cause one or the other type of statistic to appear skewed in the viewer graph.
- View current performance activity
- Click Monitoring and Tuning > Performance Viewer > Current Activity in the administrative console navigation tree.
- Select Server, then click the name of the server whose activity you want to monitor. You can alternatively select the check box for the server whose activity you want to monitor, then click Start Monitoring. To start monitoring multiple servers at the same time, select the servers then click Start Monitoring.
- Select Performance Modules.
- Select the check box beside the name of each performance module to view. IBM Business Process Manager events that emit performance statistics, and that have been invoked at least once, are listed under the WBIStats.RootGroup hierarchy. Expand the tree by clicking + next to a node and shrink it by clicking - next to a node.
- Click View Modules. A chart or table providing the requested data is displayed on the right side of the page. Charts are displayed by default.
Each module has several counters associated with it. These counters are displayed in a table underneath the data chart or table. Selected counters are displayed in the chart or table. You can add or remove counters from the chart or table by selecting or clearing the check box next to them. By default, the first three counters for each module are shown.
You can select up to 20 counters and display them in the TPV in the Current Activity mode.
- To remove a module from a chart or table, clear the check box next to the module then click View Modules again.
- To view the data in a table, click View Table on the counter selection table. To toggle back to a chart, click View Graph.
- To view the legend for a chart, click Show Legend. To hide the legend, click Hide Legend.
- When you have finished monitoring the performance of your events, click Tivoli Performance Viewer, select the server you were monitoring, and click Stop Monitoring.
- Log performance statistics
While monitoring is active on a server, you can log the data from all the PMI counters that are currently enabled and record the results in a TPV log file. You can view the TPV log file for a particular time period multiple times, selecting different combinations of up to 20 counters each time. You have the flexibility to observe the relationships among different performance measures in the server during a particular period.
- Click Start Logging when viewing summary reports or performance modules.
- When finished, click Stop Logging. By default, the log files are stored in the profile_root/logs/tpv directory on the node on which the server is running. The TPV automatically compresses the log file when it finishes writing to it to conserve space. There must only be a single log file in each compressed file and it must have the same name as the compressed file.
- Click Monitoring and Tuning > Performance Viewer > View Logs in the administrative console navigation tree to view the logs
Related concepts:
Related tasks:
Specifying performance statistics to monitor
WAS documentation Network Deployment
Tutorial: Service component performance monitoring
View and interpreting service component event log files
This topic discusses how you would interpret the information in a log file generated by service component monitoring. You can view the log files in the log viewer on the administrative console, or in a separate text file editor of your choice.
Events fired to the logger by service component monitoring are encoded in Common Base Event format. When published to a log file, the event is included as a single, lengthy line of text in XML tagging format, which also includes several logger-specific fields. Consult the event catalog section of this documentation for details on deciphering the Common Base Event coding of the logged event. Use this section to understand the other fields contained in each entry of the log file, and how the format you chose for the log file when you configured the logger is structured.
Basic and advanced format fields
Logging output can be directed either to a file or to an in-memory circular buffer. If trace output is directed to the in-memory circular buffer, it must be dumped to a file before it can be viewed. Output is generated as plain text in either basic, advanced or log analyzer format as specified by the user. The basic and advanced formats for output are like the basic and advanced formats that are available for the message logs. Basic and Advanced Formats use many of the same fields and formatting techniques. The fields that can be used in these formats include:
- TimeStamp
- The timestamp is formatted using the locale of the process where it is formatted. It includes a fully qualified date (YYMMDD), 24 hour time with millisecond precision and the time zone.
- ThreadId
- An 8-character hexadecimal value generated from the hash code of the thread that issued the trace event.
- ThreadName
- The name of the Java™ thread that issued the message or trace event.
- ShortName
- The abbreviated name of the logging component that issued the trace event. This is typically the class name for BPM internal components, but can be some other identifier for user applications.
- LongName
- The full name of the logging component that issued the trace event. This is typically the fully qualified class name for BPM internal components, but can be some other identifier for user applications.
- EventType
- A one-character field that indicates the type of the trace event.
Trace types are in lowercase. Possible values include:
- 1
- a trace entry of type fine or event.
- 2
- a trace entry of type finer.
- 3
- a trace entry of type finest, debug, or dump.
- Z
- a placeholder to indicate the trace type was not recognized.
- ClassName
- The class that issued the message or trace event.
- MethodName
- The method that issued the message or trace event.
- Organization
- The organization that owns the application that issued the message or trace event.
- Product
- The product that issued the message or trace event.
- Component
- The component within the product that issued the message or trace event.
Basic format
Trace events displayed in basic format use the following format:
<timestamp><threadId><shortName><eventType>[className][methodName]<textmessage>
               [parameter 1]
               [parameter 2]
Advanced format
Trace events displayed in advanced format use the following format:
<timestamp><threadId><eventType><UOW><source=longName>[className][methodName]
<Organization><Product><Component>[thread=threadName]
<textMessage>[parameter 1=parameterValue][parameter 2=parameterValue]
Log analyzer format
Specifying the log analyzer format allows you to open trace output using the Log Analyzer tool, which is an application included with WebSphere Application Server. This is useful if you are trying to correlate traces from two different server processes, because it allows you to use the merge capability of the Log Analyzer.
Related concepts:
Configure logging for service component events
Audit logging for business rules and selectors
Related tasks:
Configure logging properties using the administrative console
Health and problem determination with Business Space
An integral part of administering a solution is tracking the health of all the administrative artifacts that comprise a module (queues, messaging engines, data sources, servers, and clusters, to name just a few), as well as the health of the overall system.
Use the widgets in the Problem Determination template to answer questions like the following:
- Are all of my applications running?
- Are any parts of my topology stopped or unavailable?
- Are my queues reaching maximum depth?
- Are all of my system messaging engines running?
- Are there any failed events in the module?
- What is the overall system health?
This information helps you determine what part of your solution is not responding as expected.
- Determining module health Use the Module Health widgets to examine the health status of a module and its topology, system components, queues, data sources, and system messaging engines.
Determining module health
Use the Module Health widgets to examine the health status of a module and its topology, system components, queues, data sources, and system messaging engines.
If you have turned on security in Business Space, make sure that you are using both administrative security and application security. See Set up security for Business Space.
Required security role for this task: If administrative security is enabled, you must be logged in as an administrator or operator to perform this task.
The Module Health widget offers a picture of the overall health of your module and the health of the individual artifacts in the module. It also lists the number and types of failed events in the module.
The widget does not provide accurate status information for the following types of data sources:
- Custom data sources or support cluster data sources that were not configured as part of the deployment environment. These data sources are not listed in the widget.
- A data source whose authentication alias is not set. In this case, the data source is listed in the widget but its status is Unavailable.
Use the administrative console to determine the actual status, as described in
 Test connection problems for messaging engine data sources.
- Log in to Business Space with administrator privileges and open the page that contains the Module Health and Module Browser widgets (by default, the Module Health page in the Problem Determination template). The Module Browser widget lists all the modules currently deployed to the cell.
- Use the Module Browser to find and select the module which you want to view the health status.
The Module Health widget refreshes to show health information for the selected module.
- Use the tabs in the Module Health widget to examine the status of the module and its artifacts. A warning icon at the top of a tab alerts you to problems with one or more resources in the module.
To create assess the health of your system (not just a module), use the System Health widget.
Event catalog
The event catalog contains the specifications for all the events that can be monitored for each service component type, and the associated Common Base Event extended data elements produced by each event.
Use the information presented in this section as reference material that enables you to understand how individual events are structured. This knowledge helps you decipher the information contained in each event, so that you can quickly identify the pieces of information you need from the relatively large amount of data generated by each event.
The information included in this section covers the following items:
- The structure and standard elements of the Common Base Event
- The list of events for the Business Process Choreographer service components
- The list of IBM Business Process Manager-specific service components
- The extensions to the Common Base Event unique to each event type
There is also a discussion of how business objects that might be processed by a service component are captured in service component events.
When an event of a given type is fired across the Common Event Infrastructure (CEI) bus to the CEI server or to a logger, it takes the form of a Common Base Event - which is, essentially, an XML encapsulation of the event elements created according to the event catalog specification. The Common Base Event includes a set of standard elements, server component identification elements, Event Correlation Sphere identifiers, and additional elements unique to each event type. All of these elements are passed to the CEI server or logger whenever an event is fired by a service component monitor, with one exception: if the event includes the business object code within the payload, you may specify the amount of business object data to include in event.
- The Common Base Event standard elements The elements of the Common Base Event that are included in all events fired from service component monitoring are listed here.
- Business objects in events Business object data is carried within the event in XML format. The Common Base Event format includes an xs:any schema, which encapsulates the business object payload in XML elements.
- Business Process Choreographer events IBM Business Process Manager incorporates the Business Process Choreographer service components for BPEL processes and human tasks. Both BPEL processes and human tasks have their own set of event points that can be monitored.
- IBM Business Process Manager Advanced events IBM Business Process Manager features its own service components, and each of these components has its own set of event points that can be monitored.
Related concepts:
Service component monitoring overview
Configure logging for service component events
View and interpreting service component event log files
The Common Base Event standard elements
The elements of the Common Base Event that are included in all events fired from service component monitoring are listed here.
| Attribute | Description |
|---|---|
| version | Set to 1.0.1. |
| creationTime | The time at which the event is created, in UTC. |
| globalInstanceId | The identifier of the Common Base Event instance. This ID is automatically generated. |
| localInstanceId | This ID is automatically generated (might be blank). |
| severity | The impact the event has on business processes or on human tasks. This attribute is set to 10 (information). Otherwise, it is not used. |
| priority | Not used. |
| reporterComponentId | Not used. |
| locationType | Set to Hostname. |
| location |
|
| application | Not used. |
| executionEnvironment | A string that identifies the operating system. |
| component | Process server version. For business processes and human tasks: Set to WPS#, followed by the SCA version, the identification of the current platform, and the version identification of the underlying software stack. |
| componentType | The component QName, based on the Apache QName format.
For business processes, set to: www.ibm.com/namespaces/autonomic/Workflow_Engine For human tasks, set to: www.ibm.com/xmlns/prod/websphere/scdl/human-task |
| subComponent | The observable element name.
For business processes, set to BFM. For human tasks, set to HTM. |
| componentIdType | Set to ProductName. |
| instanceId | The identifier of the server. This identifier has the format cell_name/node_name/server_name. The delimiters are operating system dependent. |
| processId | The process identifier of the operating system. |
| threadId | The thread identifier of the Java™ virtual machine (JVM). |
| Situation Type | The type of situation that caused the event to be reported. For specific components, set to ReportSituation. |
| Situation Category | The category of the type of situation that caused the event to be reported. For specific components, set to STATUS. |
| Situation Reasoning Scope | The scope of the impact of the situation reported. For specific components, set to EXTERNAL. |
| ECSCurrentID | The value of the current Event Correlation Sphere ID. |
| ECSParentID | The value of the parent Event Correlation Sphere ID. |
| WBISessionID | The value of the current Session ID. |
| extensionName | Set to the event name. |
Business objects in events
Business object data is carried within the event in XML format. The Common Base Event format includes an xs:any schema, which encapsulates the business object payload in XML elements.
You specify the level of business object detail that will be captured in service component events. This level of detail affects only the amount of business object code that will be passed to the event; all the other Common Base Event elements (both standard and event-specific) will be published to the event.
The names of the detail levels applicable to service component events differ depending on whether you created a static monitor using IBM Integration Designer or a dynamic monitor on the administrative console, but they correspond as shown in the following table:
| Administrative console detail level | Common Base Event/Integration Designer detail level | Payload information published |
|---|---|---|
| FINE | EMPTY | None. |
| FINER | DIGEST | Payload description only. |
| FINEST | FULL | All of the payload. |
The detail level is specified by the PayloadType element, which is part of the event instance data. The actual business object data is included in the event only if the monitor is set to record FULL/FINEST detail.
The business object data itself is included in the Common Base Event under an xsd:any schema. You can see the process server business object payloads with the root element named wbi:event.
If you are publishing the event output to the logger, you will see the output when you view the log files.
Business Process Choreographer events
IBM Business Process Manager incorporates the Business Process Choreographer service components for BPEL processes and human tasks. Both BPEL processes and human tasks have their own set of event points that can be monitored.
- BPEL process events overview Events that are emitted on behalf of BPEL processes consist of situation-independent data and data that is specific to BPEL process events. The attributes and elements that are specific to BPEL process events are described.
- Human task events overview
Events that are emitted on behalf of human tasks consist of situation-independent
data and data that is specific to human task events. The attributes and elements that are specific to human task events are described.
BPEL process events overview
Events that are emitted on behalf of BPEL processes consist of situation-independent data and data that is specific to BPEL process events. The attributes and elements that are specific to BPEL process events are described.
BPEL process events can have the following categories of event content.
- Event data specific to BPEL processes In BPEL processes, events relate to processes, activities, scopes, links, and variables.
- Extension names for BPEL process events The extension name indicates the payload of the event. A list of all the extension names for BPEL process events and their corresponding payload can be found here.
- Business process events Common Base Events are emitted for BPEL processes if monitoring is requested for the BPEL process elements in IBM Integration Designer. A process can cause process events, activity events, activity scope events, link events, and variable events to be emitted.
- Situations in BPEL process events Business process events can be emitted in different situations. The data for these situations is described in situation elements.
Event data specific to BPEL processes
In BPEL processes, events relate to processes, activities, scopes, links, and variables.
The events can have one of the following formats:
- Business Monitor 6.1, 6.2 or 7.0 format (XML with schema support)
- Events are produced in this format if this format is selected and there are processes modeled in WebSphere Integration Developer 6.1 or later, or IBM Integration Designer 7.5
or later.
The object-specific content for these events is written as XML elements in the xs:any slot in the eventPointData part of the Common Base Event, and the payload message is written to the applicationData section. The structure of the XML is defined in the schema definition file install_root\ProcessChoreographer\client\BFMEvents.xsd. To parse and validate the Common Base Event information, use the schema definition in install_root\ProcessChoreographer\client\WBIEvent.xsd
- Business Monitor 6.0.2 format (legacy XML)
- Events are produced in this format if there are processes modeled in WebSphere Integration Developer 6.0.2, or if the Business Monitor 6.0.2 format is selected in WebSphere Integration Developer 6.1 or later. If not specified otherwise, the object-specific content for these events is written as extendedDataElement XML elements of the type string.
- Legacy hexBinary
- Events are produced in this format if selected in Integration Designer.
Related reference:
Common Base Events for BPEL processes
Common Base Events for activities
Common Base Events for scope activities
Common Base Events for links in flow activities
Common Base Events for process variables
Extension names for BPEL process events
The extension name indicates the payload of the event. A list of all the extension names for BPEL process events and their corresponding payload can be found here.
BPEL process events conform to the Common Base Event specification. The extension name contains the string value used as the value of the extensionName attribute of the event. This is also the name of the XML element that provides additional data about the event. The names of event elements are in uppercase, for example, BPC.BFM.BASE, and the names of XML elements are in mixed case, for example, BPCEventCode. Except where indicated, all data elements are of the type string.
The following extension names are available for BPEL process events:
- BPC.BFM.ACTIVITY
-
- BPC.BFM.ACTIVITY.BASE
- BPC.BFM.ACTIVITY.CHILD_PROCESS_TERMINATING
- BPC.BFM.ACTIVITY.CLAIM
- BPC.BFM.ACTIVITY.CONDITION
- BPC.BFM.ACTIVITY.CUSTOMPROPERTYSET
- BPC.BFM.ACTIVITY.ESCALATED
- BPC.BFM.ACTIVITY.EVENT
- BPC.BFM.ACTIVITY.FAILURE
- BPC.BFM.ACTIVITY.FOREACH
- BPC.BFM.ACTIVITY.JUMPED
- BPC.BFM.ACTIVITY.MESSAGE
- BPC.BFM.ACTIVITY.SKIP_ON_EXIT_CONDITION_TRUE
- BPC.BFM.ACTIVITY.SKIP_REQUESTED
- BPC.BFM.ACTIVITY.SKIPPED_ON_REQUEST
- BPC.BFM.ACTIVITY.STATUS
- BPC.BFM.ACTIVITY.TIMER_RESCHEDULED
- BPC.BFM.ACTIVITY.WISTATUS
- BPC.BFM.ACTIVITY.WITRANSFER
- BPC.BFM.BASE
-
- BPC.BFM.LINK
-
- BPC.BFM.PROCESS
-
- BPC.BFM.PROCESS.BASE
- BPC.BFM.PROCESS.CORREL
- BPC.BFM.PROCESS.CUSTOMPROPERTYSET
- BPC.BFM.PROCESS.ESCALATED
- BPC.BFM.PROCESS.EVENT
- BPC.BFM.PROCESS.FAILURE
- BPC.BFM.PROCESS.MIGRATED
- BPC.BFM.PROCESS.MIGRATIONTRIGGERED
- BPC.BFM.PROCESS.OWNERTRANSFER
- BPC.BFM.PROCESS.PARTNER
- BPC.BFM.PROCESS.START
- BPC.BFM.PROCESS.STATUS
- BPC.BFM.PROCESS.WISTATUS
- BPC.BFM.PROCESS.WITRANSFER
- BPC.BFM.VARIABLE
-
BPC.BFM.ACTIVITY.BASE
BPC.BFM.ACTIVITY.BASE inherits the XML elements from BPC.BFM.BASE.
| >XML element | >Description |
|---|---|
| activityKind | The activity kind, for example, sequence or invoke. The format is: <kind code>-<kind
name>. This attribute can have one of the following values:
3 - KIND_EMPTY 21 - KIND_INVOKE 23 - KIND_RECEIVE 24 - KIND_REPLY 25 - KIND_THROW 26 - KIND_TERMINATE 27 - KIND_WAIT 29 - KIND_COMPENSATE 30 - KIND_SEQUENCE 32 - KIND_SWITCH 34 - KIND_WHILE 36 - KIND_PICK 38 - KIND_FLOW 40 - KIND_SCOPE 42 - KIND_SCRIPT 43 - KIND_STAFF 44 - KIND_ASSIGN 45 - KIND_CUSTOM 46 - KIND_RETHROW 47 - KIND_FOR_EACH_SERIAL 49 - KIND_FOR_EACH_PARALLEL 52 - KIND_REPEAT_UNTIL 1000 - SQLSnippet 1001 - RetrieveSet 1002 - InvokeInformationService 1003 - AtomicSQLSnippetSequence |
| state | The current state of the activity instance in the format: state code-state name. For activities, this attribute can have one of the following values:
1 - STATE_INACTIVE 2 - STATE_READY 3 - STATE_RUNNING 4 - STATE_SKIPPED 5 - STATE_FINISHED 6 - STATE_FAILED 7 - STATE_TERMINATED 8 - STATE_CLAIMED 11 - STATE_WAITING 12 - STATE_EXPIRED 13 - STATE_STOPPED For scope activities, this attribute can have one of the following values: 1 - STATE_READY 2 - STATE_RUNNING 3 - STATE_FINISHED 4 - STATE_COMPENSATING 5 - STATE_FAILED 6 - STATE_TERMINATED 7 - STATE_COMPENSATED 8 - STATE_COMPENSATION_FAILED 9 - STATE_FAILING 10 - STATE_SKIPPED 11 - STATE_COMPENSATION_FAILING 12 - STATE_FAULTHANDLER_FAILING 13 - STATE_FINISHING 14 - STATE_STOPPED |
| bpelId | The wpc:id attribute of the activity in the BPEL file. It is unique for activities in a process model. |
| activityTemplateName | The name of the activity template. this can differ from the display name. |
| activityTemplateId | The internal ID of the activity template. |
| activityInstanceDescription | The description of the activity instance. |
| principal | The name of the user on whose behalf the current action is being performed. |
| taskInstanceId | The ID of the associated human task instance. This is only included for staff activity events. |
| processTemplateId | The ID of the process template. |
BPC.BFM.ACTIVITY.CHILD_PROCESS_TERMINATING
BPC.BFM.ACTIVITY.CHILD_PROCESS_TERMINATING inherits the XML elements from BPC.BFM.ACTIVITY.BASE.
| >XML element | >Description |
|---|---|
| subState | The substate of the activity. The substate can be one of the following strings:
SUB_STATE_NONE SUB_STATE_EXPIRING SUB_STATE_SKIPPING SUB_STATE_RESTARTING SUB_STATE_FINISHING SUB_STATE_FAILING |
| childProcessInstanceID | The ProcessInstanceID of the child process. |
BPC.BFM.ACTIVITY.CLAIM
BPC.BFM.ACTIVITY.CLAIM inherits the XML elements from BPC.BFM.ACTIVITY.BASE.
| >XML element | >Description |
|---|---|
| username | The name of the user for whom the task has been claimed. |
BPC.BFM.ACTIVITY.CONDITION
BPC.BFM.ACTIVITY.CONDITION inherits the XML elements from BPC.BFM.ACTIVITY.BASE.
| >XML element | >Description |
|---|---|
| branchBpelId | This is set to the value of the wpc:id attribute of the related case element, as specified in the BPEL file. This information is provided only for processes that are installed with version 6.1.2 or later. |
| condition | This specifies the condition as a string for XPath conditions. (This property is not present for otherwise or Java™ conditions.) |
| isForced | This specifies whether the event is triggered through the forceNavigate APIs (=true), or in any other way (=false). |
| isOtherwise | This specifies whether the otherwise branch is entered (=true) or a case branch is entered (=false). |
BPC.BFM.ACTIVITY.CUSTOMPROPERTYSET
BPC.BFM.ACTIVITY.CUSTOMPROPERTYSET inherits the XML elements from BPC.BFM.ACTIVITY.BASE.
| >XML element | >Description |
|---|---|
| propertyName | The name of the custom property. |
| propertyValue | The value of the custom property. |
| ECSCurrentID | The associated process instance ID. |
| ECSParentID | The parent of the process instance. |
| associatedObjectID | The ID of the associated object that is the activity instance ID. |
| associatedObjectName | The name of the associated object that is the activity template name. |
| query | If isBinary is true, this element specifies the query string for the binary property. Otherwise, this element is not present. |
| type | If isBinary is true, this element specifies the type of the binary property. Otherwise, this element is not present. |
| isBinary | Set to false for string custom properties, and to true for binary custom properties. The payload type for binary custom properties is restricted to Empty. The property propertyValue is omitted for binary custom properties. |
BPC.BFM.ACTIVITY.ESCALATED
BPC.BFM.ACTIVITY.ESCALATED inherits the XML elements from BPC.BFM.ACTIVITY.BASE.
| >XML element | >Description |
|---|---|
| escalationName | The name of the escalation. |
| operation | This is the operation that is associated with the event handler for which the inline invocation task is escalated. |
BPC.BFM.ACTIVITY.EVENT
BPC.BFM.ACTIVITY.EVENT inherits the XML elements from BPC.BFM.ACTIVITY.BASE.
| >XML element | >Description |
|---|---|
| operation | The name of the operation for the received event. |
BPC.BFM.ACTIVITY.FAILURE
BPC.BFM.ACTIVITY.FAILURE inherits the XML elements from BPC.BFM.ACTIVITY.BASE.
| >XML element | >Description |
|---|---|
| activityFailedException | The exception that caused the activity to fail. |
| faultNamespace | The namespace URI of the fault. |
| faultName | The local part of the fault. |
BPC.BFM.ACTIVITY.FOREACH
BPC.BFM.ACTIVITY.FOREACH inherits the XML elements from BPC.BFM.ACTIVITY.BASE.
| >XML element | >Description |
|---|---|
| parallelBranchesStarted | The number of branches started. |
BPC.BFM.ACTIVITY.JUMPED
BPC.BFM.ACTIVITY.JUMPED inherits the XML elements from BPC.BFM.ACTIVITY.BASE.
| >XML element | >Description |
|---|---|
| targetName | Contains the activity template name of the target activity for the jump. The aiid contained in the ECSCurrentId of the event refers to the source activity of the jump. |
BPC.BFM.ACTIVITY.MESSAGE
BPC.BFM.ACTIVITY.MESSAGE inherits the XML elements from BPC.BFM.ACTIVITY.BASE.
| >XML element | >Description |
|---|---|
| message or message_BO | The input or the output message for the service as a string or business object (BO) representation. The format depends on whether the Monitor Compatible Events option was selected on the Event Monitor tab in IBM Integration Designer.
This attribute is only used for Business Monitor 6.0.2 format events. For Business Monitor 6.1 format events, the content of the message is written to the applicationData section, which contains one content element with the name set to the name of the message. |
BPC.BFM.ACTIVITY.SKIP_ON_EXIT_CONDITION_TRUE
BPC.BFM.ACTIVITY.SKIP_ON_EXIT_CONDITION_TRUE inherits the XML elements from BPC.BFM.ACTIVITY.BASE. No further specific properties are defined for BPC.BFM.ACTIVITY.SKIP_ON_EXIT_CONDITION_TRUE beyond the inherited properties
BPC.BFM.ACTIVITY.SKIP_REQUESTED
BPC.BFM.ACTIVITY.SKIP_REQUESTED inherits the XML elements from BPC.BFM.ACTIVITY.BASE.
| >XML element | >Description |
|---|---|
| cancel | Cancel specifies whether the activity is skipped or not to distinguish between a skip (=false) and a cancelSkipRequest (=true) call. |
BPC.BFM.ACTIVITY.SKIPPED_ON_REQUEST
BPC.BFM.ACTIVITY.SKIPPED_ON_REQUEST inherits the XML elements from BPC.BFM.ACTIVITY.BASE. No further specific properties are defined for this BPC.BFM.ACTIVITY.SKIPPED_ON_REQUEST beyond the inherited properties
BPC.BFM.ACTIVITY.STATUS
BPC.BFM.ACTIVITY.STATUS inherits the XML elements from BPC.BFM.ACTIVITY.BASE.
| >XML element | >Description |
|---|---|
| reason |
The stop reason code. The stop reason code is only relevant if the activity is in the stopped state. It indicates the reason why the activity stopped. This attribute can have one of the following values: 1 - STOP_REASON_UNSPECIFIED 2 - STOP_REASON_ACTIVATION_FAILED 3 - STOP_REASON_IMPLEMENTATION_FAILED 4 - STOP_REASON_FOLLOW_ON_NAVIGATION_FAILED 5 - STOP_REASON_EXIT_CONDITION_FALSE |
A payload is available for the event nature FRETRIED for activities that provide payload for the ENTRY event nature, and similarly for the event nature FCOMPLETED corresponding to the EXIT event nature:
- FRETRIED and ENTRY for the element kinds invoke and staff (see CREATED).
- FCOMPLETED and EXIT for the element kinds: pick, receive, and reply.
The payload is provided in the application data section of the event, but only for event version 6.1.
BPC.BFM.ACTIVITY.TIMER_RESCHEDULED
BPC.BFM.ACTIVITY.TIMER_RESCHEDULED inherits the XML elements from BPC.BFM.ACTIVITY.BASE.
| >XML element | >Description |
|---|---|
| timestamp | The date and time are expressed in Coordinated Universal Time (UTC), in the format yyyy-MM-dd[Thh:mm:ss], which represents year, month, day, T, hours, minutes, and seconds. |
BPC.BFM.ACTIVITY.WISTATUS
BPC.BFM.ACTIVITY.WISTATUS inherits the XML elements from BPC.BFM.ACTIVITY.BASE.
| >XML element | >Description |
|---|---|
| username | The names of the users who are associated with the work item. |
| reason | The reason for the assignment of the work item. Possible integer values have the following meanings:
1 - REASON_POTENTIAL_OWNER 2 - REASON_EDITOR 3 - REASON_READER 4 - REASON_OWNER 5 - REASON_POTENTIAL_STARTER 6 - REASON_STARTER 7 - REASON_ADMINISTRATOR 9 - REASON_ORIGINATOR 10 - REASON_ESCALATION_RECEIVER 11 - REASON_POTENTIAL_INSTANCE_CREATOR |
BPC.BFM.ACTIVITY.WITRANSFER
BPC.BFM.ACTIVITY.WITRANSFER inherits the XML elements from BPC.BFM.ACTIVITY.BASE.
| >XML element | >Description |
|---|---|
| current | The user name of the current owner of the work item. This is the user whose work item has been transferred to someone else. |
| target | The user name of the new owner of the work item. |
| reason | The reason for the assignment of the work item. Possible integer values have the following meanings:
1 - REASON_POTENTIAL_OWNER 2 - REASON_EDITOR 3 - REASON_READER 4 - REASON_OWNER 5 - REASON_POTENTIAL_STARTER 6 - REASON_STARTER 7 - REASON_ADMINISTRATOR 9 - REASON_ORIGINATOR 10 - REASON_ESCALATION_RECEIVER 11 - REASON_POTENTIAL_INSTANCE_CREATOR |
BPC.BFM.BASE
BPC.BFM.BASE inherits the XML elements from WBIMonitoringEvent.
| >XML element | >Description |
|---|---|
| BPCEventCode | The Business Process Choreographer event code that identifies the event nature. |
| processTemplateName | The name of the process template. This name can differ from the display name. |
| processTemplateValidFrom | The valid from attribute of the process template. |
| eventProgressCounter | The event progress counter is used to indicate the position of the current navigation step in the execution order of all navigation steps of the same process instance.
The event progress counter is required for long-running processes, and it can be used together with the event local counter to re-create the (possibly incomplete) order of the events belonging to the same process instance. In microflows, the event progress counter is set to zero. |
| eventLocalCounter | The local counter is used to discover the order of two events that occur in the same transaction. For a microflow instance, this counter reconstructs an order of all the emitted events. For long-running processes, the local counter indicates an order in the current navigation transaction. |
| processInstanceName | The process instance name, as provided by an API invocation, is only present if it is different from the process instance ID. |
| processInstanceId | The ID of the process instance. |
BPC.BFM.LINK.STATUS
BPC.BFM.LINK.STATUS inherits the XML elements from BPC.BFM.BASE.
| >XML element | >Description |
|---|---|
| elementName | The name of the link. |
| description | The description of the link. |
| flowBpelId | The ID of the flow activity where the link is defined. |
| sourceBpelId | The wpc:id attribute of the source activity corresponding to the navigated link. |
| targetBpelId | The wpc:id attribute of the target activity corresponding to the navigated link. |
| isForced | This specifies whether the event is triggered through the forceNavigate APIs (=true), or in any other way (=false). |
| processTemplateId | The ID of the process template. |
BPC.BFM.PROCESS.BASE
BPC.BFM.PROCESS.BASE inherits the XML elements from BPC.BFM.BASE.
| >XML element | >Description |
|---|---|
| processInstanceExecutionState | The current execution state of the process in the following format: <state code>-<state
name>. This attribute can have one of the following values:
1 - STATE_READY 2 - STATE_RUNNING 3 - STATE_FINISHED 4 - STATE_COMPENSATING 5 - STATE_FAILED 6 - STATE_TERMINATED 7 - STATE_COMPENSATED 8 - STATE_TERMINATING 9 - STATE_FAILING 11 - STATE_SUSPENDED 12 - STATE_COMPENSATION_FAILED |
| processTemplateId | The ID of the process template. |
| processInstanceDescription | The description of the process instance. |
| principal | The name of the user who is associated with this event. |
BPC.BFM.PROCESS.CORREL
BPC.BFM.PROCESS.CORREL inherits the XML elements from BPC.BFM.PROCESS.BASE.
| >XML element | >Description |
|---|---|
| correlationSet | This is a hexBinary string. After converting it to a string, it has the following format:
<?xml version="1.0"?>
<correlationSet name="correlation_set_name">
  <property name="property_name"
            value="property_value"/>*
</correlationSet>
|
| action | Contains one of the following strings:
|
BPC.BFM.PROCESS.CUSTOMPROPERTYSET
BPC.BFM.PROCESS.CUSTOMPROPERTYSET inherits the XML elements from BPC.BFM.PROCESS.BASE.
| >XML element | >Description |
|---|---|
| propertyName | The name of the custom property. |
| propertyValue | The value of the custom property. |
| ECSCurrentID | The associated process instance ID. |
| ECSParentID | The parent of the process instance. |
| associatedObjectID | The ID of the associated object that is the process instance ID. |
| associatedObjectName | The name of the associated object that is the process template name. |
| query | If isBinary is true, this element specifies the query string for the binary property. Otherwise, this element is not present. |
| type | If isBinary is true, this element specifies the type of the binary property. Otherwise, this element is not present. |
| isBinary | Set to false for string custom properties, and to true for binary custom properties. The payload type for binary custom properties is restricted to Empty. The property propertyValue is omitted for binary custom properties. |
BPC.BFM.PROCESS.ESCALATED
BPC.BFM.PROCESS.ESCALATED inherits the XML elements from BPC.BFM.PROCESS.BASE.
| >XML element | >Description |
|---|---|
| escalationName | The name of the escalation. |
| operation | This is the operation that is associated with the event handler for which the inline invocation task is escalated. |
| portTypeName | The port type name of the operation that is associated with the event handler for which the inline invocation task is escalated. |
| portTypeNamespace | The port type namespace of the operation that is associated with the event handler for which the inline invocation task is escalated. |
BPC.BFM.PROCESS.EVENT
BPC.BFM.PROCESS.EVENT inherits the XML elements from BPC.BFM.PROCESS.BASE.
| >XML element | >Description |
|---|---|
| message or message_BO- | The input message or the output message for the service as a String or business object (BO) representation. The format depends on whether the Monitor Compatible Events option was selected on the Event Monitor tab in IBM Integration Designer.
This attribute is only used for Business Monitor 6.0.2 format events. For Business Monitor 6.1 format events, the content of the message is written to the applicationData section, which contains one content element with the name set to the name of the message. |
| operation | Name of the operation for the received event. |
| portTypeName | The port type name of the operation that is associated with the event handler. |
| portTypeNamespace | The port type namespace of the operation that is associated with the event handler. |
BPC.BFM.PROCESS.FAILURE
BPC.BFM.PROCESS.FAILURE inherits the XML elements from BPC.BFM.PROCESS.BASE.
| >XML element | >Description |
|---|---|
| processFailedException | The exception message that lead to the failure of the process. |
| faultNamespace | The namespace URI of the fault. |
| faultName | The local part of the fault. |
BPC.BFM.PROCESS.MIGRATED
BPC.BFM.PROCESS.MIGRATED inherits the XML elements from BPC.BFM.PROCESS.BASE.
| >XML element | >Description |
|---|---|
| migratedFromPTID | The ID of the process template that is being migrated from. |
| migratedFromValidFrom | The validFrom date for the process template that is being migrated from. |
After the migration, information about the activity instances within the process is provided in a business object (BO) in the application data section of the event. The business object is defined by in the install_root/ProcessChoreographer/client/BFMEvent_Data_V7.xsd file.  On Windows platforms, it is in install_root\ProcessChoreographer\client\BFMEvent_Data_V7.xsd. The business object contains the following information for each activity that has been migrated.
| >XML element | >Description |
|---|---|
| activityInstanceID | The ID of the activity instance. |
| activityState | The current execution state of the activity in the following format: state_code-state_name |
| activitySubState | The current execution substate of the activity in the following format: substate_code-substate_name |
| activityStopReason |
The stop reason code. The stop reason code is only relevant if the activity is in the stopped state. It indicates the reason why the activity stopped. This attribute can have one of the following values: 1 - STOP_REASON_UNSPECIFIED 2 - STOP_REASON_ACTIVATION_FAILED 3 - STOP_REASON_IMPLEMENTATION_FAILED 4 - STOP_REASON_FOLLOW_ON_NAVIGATION_FAILED 5 - STOP_REASON_EXIT_CONDITION_FALSE |
| bpelId | The BPEL ID of the activity. |
| activityTemplateName | The name of the activity template. |
| activityTemplateId | The ID of the activity template. |
BPC.BFM.PROCESS.MIGRATIONTRIGGERED
BPC.BFM.PROCESS.MIGRATIONTRIGGERED inherits the XML elements from BPC.BFM.PROCESS.BASE.
| >XML element | >Description |
|---|---|
| migrateToPTID | The ID of the process template to migrate to. |
| migrateToValidFrom | The validFrom date for the process template to migrate to. |
Before the migration, information about the activity instances within the process is provided in a business object (BO) in the application data section of the event. The business object is defined in the install_root/ProcessChoreographer/client/BFMEvent_Data_V7.xsd file. On Windows platforms, it is in install_root\ProcessChoreographer\client\BFMEvent_Data_V7.xsd. The business object contains the following information for each activity that will be migrated.
| >XML element | >Description |
|---|---|
| activityInstanceID | The ID of the activity instance. |
| activityState | The current execution state of the activity in the following format: state_code-state_name |
| activitySubState | The current execution substate of the activity in the following format: substate_code-substate_name |
| activityStopReason |
The stop reason code. The stop reason code is only relevant if the activity is in the stopped state. It indicates the reason why the activity stopped. This attribute can have one of the following values: 1 - STOP_REASON_UNSPECIFIED 2 - STOP_REASON_ACTIVATION_FAILED 3 - STOP_REASON_IMPLEMENTATION_FAILED 4 - STOP_REASON_FOLLOW_ON_NAVIGATION_FAILED 5 - STOP_REASON_EXIT_CONDITION_FALSE |
| bpelId | The BPEL ID of the activity. |
| activityTemplateName | The name of the activity template. |
| activityTemplateId | The ID of the activity template. |
BPC.BFM.PROCESS.OWNERTRANSFER
BPC.BFM.PROCESS.OWNERTRANSFER inherits the XML elements from BPC.BFM.PROCESS.BASE.
| >XML element | >Description |
|---|---|
| current | The user name of the current owner of the process. This is the user whose process is transferred to someone else. |
| target | The user name of the new owner of the process. |
BPC.BFM.PROCESS.PARTNER
BPC.BFM.PROCESS.PARTNER inherits the XML elements from BPC.BFM.PROCESS.BASE.
| >XML element | >Description |
|---|---|
| partnerLinkName | The name of the partner link. |
The endpoint reference for a BPC.BFM.PROCESS.PARTNER event is only written to the application data section of the event for version 6.1 events. The payload is the Web Services Business Process Execution Language (WS-BPEL) ServiceRefType wrapper element that contains the Web Services Addressing (WS-Addressing) EndpointReferenceType element. The ServiceRefType artifact (schema) must be available in the context of the application, which is the case in typical scenarios. However, if you dynamically assign an endpoint from one statically defined partner link to another, the schema is not available, and the endpoint reference is not included.
BPC.BFM.PROCESS.START
BPC.BFM.PROCESS.START inherits the XML elements from BPC.BFM.PROCESS.BASE.
| >XML element | >Description |
|---|---|
| username | The name of the user who requested the start or restart of the process. |
BPC.BFM.PROCESS.STATUS
BPC.BFM.PROCESS.STATUS inherits the XML elements from BPC.BFM.PROCESS.BASE.
BPC.BFM.PROCESS.WISTATUS
BPC.BFM.PROCESS.WISTATUS inherits the XML elements from BPC.BFM.PROCESS.BASE.
| >XML element | >Description |
|---|---|
| username | The names of the users with work items that were created or deleted. |
| reason | The reason for the assignment of the work item. Possible integer values have the following meanings:
1 - REASON_POTENTIAL_OWNER 2 - REASON_EDITOR 3 - REASON_READER 4 - REASON_OWNER 5 - REASON_POTENTIAL_STARTER 6 - REASON_STARTER 7 - REASON_ADMINISTRATOR 9 - REASON_ORIGINATOR 10 - REASON_ESCALATION_RECEIVER 11 - REASON_POTENTIAL_INSTANCE_CREATOR |
BPC.BFM.PROCESS.WITRANSFER
BPC.BFM.PROCESS.WITRANSFER inherits the XML elements from BPC.BFM.PROCESS.BASE.
| >XML element | >Description |
|---|---|
| current | The user name of the current owner of the work item. This is the user whose work item has been transferred to someone else. |
| target | The user name of the new owner of the work item. |
| reason | The reason for the assignment of the work item. Possible integer values have the following meanings:
1 - REASON_POTENTIAL_OWNER 2 - REASON_EDITOR 3 - REASON_READER 4 - REASON_OWNER 5 - REASON_POTENTIAL_STARTER 6 - REASON_STARTER 7 - REASON_ADMINISTRATOR 9 - REASON_ORIGINATOR 10 - REASON_ESCALATION_RECEIVER 11 - REASON_POTENTIAL_INSTANCE_CREATOR |
BPC.BFM.VARIABLE.STATUS
BPC.BFM.VARIABLE.STATUS inherits the XML elements from BPC.BFM.BASE.
| >XML element | >Description |
|---|---|
| variableName | The name of the variable. |
| variableData or variableData_BO | If the variable variableName is not initialized, there is no variableData or VariableData_BO element.
The variable's data is represented either as a String or business object (BO). The format depends on whether the Monitor Compatible Events option was selected on the Event Monitor tab in IBM Integration Designer.
This attribute is only used for Business Monitor 6.0.2 format events. For Business Monitor 6.1 format events, the content of the variable is written to the applicationData section, which contains one content element with the name set to the name of the variable. |
| bpelId | The Business Process Choreographer ID for the variable. |
| principal | The name of the user on whose behalf the current action is being performed. |
| processTemplateId | The ID of the process template. |
Related reference:
Common Base Events for BPEL processes
Common Base Events for activities
Common Base Events for scope activities
Common Base Events for links in flow activities
Common Base Events for process variables
Business process events
Common Base Events are emitted for BPEL processes if monitoring is requested for the BPEL process elements in IBM Integration Designer. A process can cause process events, activity events, activity scope events, link events, and variable events to be emitted.
All BPEL process events can be emitted in both the CEI and the audit trail, with the exception of the process template events. The process template events PROCESS_INSTALLED and PROCESS_UNINSTALLED can only be emitted in the audit trail.
A human task activity has an associated inline human task. When you define your BPEL process, you can specify that both the activity and its associated inline human task emit events.
The event structure is described in the XML Schema Definition (XSD) file BFMEvents.xsd. The file can be found in the install_root\ProcessChoreographer\client directory.
- Common Base Events for BPEL processes Common Base Events are emitted for BPEL processes if monitoring is requested for the BPEL process in IBM Integration Designer. A list of all the events that can be emitted by a BPEL process can be found here. These events are also written to the audit log.
- Common Base Events for activities Common Base Events are emitted for activities if monitoring is requested for these activities in IBM Integration Designer. A list of all the events that can be emitted by an activity can be found here. These events are also written to the audit log.
- Common Base Events for scope activities Common Base Events are emitted for scope activities if monitoring is requested for these activities in IBM Integration Designer. A list of all the events that can be emitted by an activity scope can be found here. These events are also written to the audit log.
- Common Base Events for links in flow activities Common Base Events for links are emitted if monitoring is requested in IBM Integration Designer for the flow activity on which the link is defined. A list of all the events that can be emitted by a link can be found here. These events are also written to the audit log.
- Common Base Events for process variables Common Base Events are emitted for process variables if monitoring is requested for the BPEL process elements in IBM Integration Designer. A list of all the events that can be emitted by variables can be found here. These events are also written to the audit log.
Related concepts:
State transition diagrams for process instances
State transition diagrams for activities
Related reference:
Event data specific to BPEL processes
Situations in BPEL process events
Extension names for BPEL process events
Common Base Events for BPEL processes
Common Base Events are emitted for BPEL processes if monitoring is requested for the BPEL process in IBM Integration Designer. A list of all the events that can be emitted by a BPEL process can be found here. These events are also written to the audit log.
State transitions and process events
The following diagram shows the state transitions that can occur for a BPEL process and the events that are emitted when these state changes take place. The link between each state indicates the nature of the event and the event code of the event that is emitted for the state transitions.
Figure 1. State transitions and process events
Process events
The columns in the following table contain:
- Code
- Contains the number of the event. For Business Monitor 6.0.2 format events, the value is written to the Common Base Event as an extended data element with the name BPCEventCode. For Business Monitor 6.1 format events, the value is written to the xs:any slot of the Common Base Event.
- Event name and extension name
- This column contains two values. The name of the event and the value that is set in the extensionName attribute of the Common Base Event. The extension name identifies which event specific information is contained in the Common Base Event, and it is also the name of the XML element that provides additional data about the event.
- Situation
- Refers to the situation name of the BPEL process event.
- Event nature
- A pointer to the event situation for a BPEL process element in the EventNature parameter, as they are displayed in IBM Integration Designer.
Some process events are emitted without a state change. The following table describes all process events.
| Code | Event name and extension name | Situation | Event nature | Description |
|---|---|---|---|---|
| 21000 |
PROCESS_STARTED BPC.BFM.PROCESS.START | Start | ENTRY | Process started |
| 21001 |
PROCESS_SUSPENDED BPC.BFM.PROCESS.STATUS | Report | SUSPENDED | Process suspended. To suspend process instances, use Business Process Choreographer Explorer. |
| 21002 |
PROCESS_RESUMED BPC.BFM.PROCESS.STATUS | Report | RESUMED | Process resumed. Only suspended processes can be resumed. To resume process instances, use Business Process Choreographer Explorer. |
| 21004 |
PROCESS_COMPLETED BPC.BFM.PROCESS.STATUS | Stop | EXIT | Process completed |
| 21005 |
PROCESS_TERMINATED BPC.BFM.PROCESS.STATUS | Stop | TERMINATED | Process terminated. To terminate process instances, use Business Process Choreographer Explorer. |
| 21019 |
PROCESS_RESTARTED BPC.BFM.PROCESS.START | Report | RESTARTED | Process restarted. A process is restarted on request, for example, by using Business Process Choreographer Explorer. |
| 21020 |
PROCESS_DELETED BPC.BFM.PROCESS.STATUS | Destroy | DELETED | Process deleted |
| 42001 |
PROCESS_FAILED BPC.BFM.PROCESS. FAILURE | Fail | FAILED | Process failed |
| 42003 |
PROCESS_COMPENSATING BPC.BFM.PROCESS.STATUS | Report | COMPENSATING | Process compensating. Only child processes can be compensated. The compensation of a child process is triggered by a fault handler or compensation handler associated with the parent process. |
| 42004 |
PROCESS_COMPENSATED BPC.BFM.PROCESS.STATUS | Stop | COMPENSATED | Process compensated |
| 42006 |
PROCESS_INSTALLED | Report | INSTALLED | These are process instance events, which are only emitted in the audit trail. They are not emitted as common base events, and are included here for completeness. |
| 42007 |
PROCESS_UNINSTALLED | Report | UNINSTALLED | These are process instance events, which are only emitted in the audit trail. They are not emitted as common base events, and are included here for completeness. |
| 42009 |
PROCESS_TERMINATING BPC.BFM.PROCESS.STATUS | Report | TERMINATING | Process terminating |
| 42010 |
PROCESS_FAILING BPC.BFM.PROCESS.STATUS | Report | FAILING | Process failing |
| 42027 |
PROCESS_CORRELATION_ SET_INITIALIZED BPC.BFM.PROCESS.CORREL | Report | CORRELATION | This event is emitted when a new correlation set for the process instance is initialized, for example, when a receive activity with an initiating correlation set receives a message.
This event is not associated with a state change. |
| 42041 |
PROCESS_WORKITEM_ DELETED BPC.BFM.PROCESS. WISTATUS | Report | WI_DELETED | Process work item deleted. This event is emitted only when a work item is explicitly deleted by an API request.
If the work item is deleted because the corresponding process instance is deleted, an event is not emitted.
This event is not associated with a state change. |
| 42042 |
PROCESS_WORKITEM_ CREATED BPC.BFM.PROCESS. WISTATUS | Report | WI_CREATED | Process work item created. This event is emitted when an additional work item is created for the process, for example, by an API request.
This event is not associated with a state change. |
| 42046 |
PROCESS_COMPENSATION_FAILED BPC.BFM.PROCESS.STATUS | Fail | COMPFAILED | Process compensation failed |
| 42047 |
PROCESS_EVENT_RECEIVED BPC.BFM.PROCESS.EVENT | Report | EV_RECEIVED | Process event received. The event is emitted when an event handler that is associated with a process is activated.
This event is not associated with a state change. |
| 42049 |
PROCESS_EVENT_ESCALATED BPC.BFM.PROCESS.ESCALATED | Report | EV_ESCALATED | Process event escalated. This event is emitted when an inline invocation task is escalated that is associated with an onEvent event handler for the process.
This event is not associated with a state change. |
| 42056 |
PROCESS_WORKITEM_ TRANSFERRED BPC.BFM.PROCESS. WITRANSFER | Report | WI_ TRANSFERRED | Process work item transferred.
This event is not associated with a state change. |
| 42058 |
PROCESS_PARTNER_CHANGED BPC.BFM.PROCESS.PARTNER | Report | PA_CHANGE | Process partner changed. This event is emitted when a new endpoint reference is assigned to a partner link.
This event is not associated with a state change. |
| 42059 |
PROCESS_CUSTOMPROPERTY_SET BPC.BFM.PROCESS. CUSTOMPROPERTYSET | Report | CP_SET | Process custom property set. This event is emitted when a custom property of a process instance is changed.
This event is not associated with a state change. |
| 42071 |
PROCESS_OWNER_TRANSFERRED BPC.BFM.PROCESS.OWNERTRANSFER | Report | OWNER_ TRANSFERRED | This event is emitted when the ownership of a process is transferred from one user to another.
This event is not associated with a state change. |
| 42077 |
PROCESS_CORRELATION_SET_SET BPC.BFM.PROCESS.CORREL | Report | CORRELATION | This event is emitted when the value of a correlation set for the process instance is set.
This event is not associated with a state change. |
| 42078 |
PROCESS_CORRELATION_SET_UNSET BPC.BFM.PROCESS.CORREL | Report | CORRELATION | This event is emitted when the value of a correlation set for the process instance is deleted or unset.
This event is not associated with a state change. |
| 42079 |
PROCESS_MIGRATED BPC.BFM.PROCESS.MIGRATED | Report | MIGRATED | This event is emitted when a process is migrated to use a new template.
This event is not associated with a state change. |
| 42080 |
PROCESS_MIGRATION_TRIGGERED BPC.BFM.PROCESS. MIGRATIONTRIGGERED | Report | MIGRATION_ TRIGGERED | This event is emitted when the migration of process instances to use a new template is started.
This event is not associated with a state change. |
For process events, the following event correlation sphere identifiers have the following content:
- The ECSCurrentID provides the ID of the process instance.
- The ECSParentID provides the value of the ECSCurrentID before the process instance start event of the current process.
Related reference:
Event data specific to BPEL processes
Situations in BPEL process events
Extension names for BPEL process events
Common Base Events for activities
Common Base Events are emitted for activities if monitoring is requested for these activities in IBM Integration Designer. A list of all the events that can be emitted by an activity can be found here. These events are also written to the audit log.
State transitions and activity events
The state changes and the events that are emitted depend on the type of activity:
- Invoke, assign, empty, reply, rethrow, throw, terminate, and Java snippet activities
Figure 1. State transitions and events for invoke activities and short-lived activities

- Pick (receive choice), wait, and receive activities
Figure 2. State transitions and events for wait, and receive activities

- Human task activities
Figure 3. State transitions and events for human task activities

- Structured activities, such as flow or sequence activities
Figure 4. State transitions and events for structured activities

Activity events
The columns in the following table contain:
- Code
- Contains the number of the event. For Business Monitor 6.0.2 format events, the value is written to the Common Base Event as an extended data element with the name BPCEventCode. For Business Monitor 6.1 format events, the value is written to the xs:any slot of the Common Base Event.
- Event name and extension name
- This column contains two values. The name of the event and the value that is set in the extensionName attribute of the Common Base Event. The extension name identifies which event specific information is contained in the Common Base Event, and it is also the name of the XML element that provides additional data about the event.
- Situation
- Refers to the situation name of the BPEL process event.
- Event nature
- A pointer to the event situation for a BPEL process element in the EventNature parameter, as they are displayed in IBM Integration Designer.
The following table describes all activity events.
| Code | Event name and extension name | Situation | Event nature | Description |
|---|---|---|---|---|
| 21006 |
ACTIVITY_READY BPC.BFM.ACTIVITY. MESSAGE | Start | CREATED | Activity ready. This event is emitted when a human task activity is started. |
| 21007 |
ACTIVITY_STARTED For invoke activities: BPC.BFM.ACTIVITY. MESSAGE For all other activity types: BPC.BFM.ACTIVITY. STATUS | Start | ENTRY | Activity started. For invoke activities, a business object payload is available. |
| 21011 |
ACTIVITY_COMPLETED For invoke, human task, receive, and reply activities: BPC.BFM.ACTIVITY. MESSAGE For pick activities: BPC.BFM.ACTIVITY.EVENT For all other activity types: BPC.BFM.ACTIVITY. STATUS | Stop | EXIT | Activity completed. For invoke, human task, receive, and reply activities, a business object payload is available. |
| 21021 |
ACTIVITY_CLAIM_ CANCELED BPC.BFM.ACTIVITY. STATUS | Report | DEASSIGNED | Claim canceled. This event is emitted when the claim for a human task activity is canceled. |
| 21022 |
ACTIVITY_CLAIMED BPC.BFM.ACTIVITY. CLAIM | Report | ASSIGNED | Activity claimed. This event is emitted when a human task activity is claimed. |
| 21027 |
ACTIVITY_ TERMINATED BPC.BFM.ACTIVITY. STATUS | Stop | TERMINATED | Activity terminated. Long-running activities can be terminated as an effect of fault handling on the scope or process the activity is assigned to. |
| 21080 |
ACTIVITY_FAILED BPC.BFM.ACTIVITY. FAILURE | Failed | FAILED | Activity failed. This event is emitted if a fault occurs when the activity runs and the fault is propagated to the fault handlers that are defined for the enclosing scopes or process. |
| 21081 |
ACTIVITY_EXPIRED BPC.BFM.ACTIVITY. STATUS | Report | EXPIRED | Activity expired. This event applies to invoke and human task activities only. |
| 42005 |
ACTIVITY_SKIPPED BPC.BFM.ACTIVITY. STATUS | Report | SKIPPED | Activity skipped. This event applies only to activities that have join behavior defined. If the join behavior evaluates to false, then the activity is skipped and the skipped event is emitted. |
| 42012 |
ACTIVITY_OUTPUT_ MESSAGE_SET BPC.BFM.ACTIVITY. MESSAGE | Report | OUTPUTSET | Activity output message set. A business object payload is available.
This event is emitted when the output message for a claimed human task activity is set without completing the activity, for example, to store intermediate results. The state of the activity does not change. This event is not emitted when a human task activity is completed. |
| 42013 |
ACTIVITY_FAULT_ MESSAGE_SET BPC.BFM.ACTIVITY. MESSAGE | Report | FAULTSET | Activity fault message set. Business object payload is available.
This event is emitted when a fault message for a claimed human task activity is set without completing the activity. This event is not emitted when a human task activity is completed with a fault. |
| 42015 |
ACTIVITY_STOPPED BPC.BFM.ACTIVITY. STATUS | Stop | STOPPED | Activity stopped. An activity can be stopped if an unhandled fault occurs when the activity runs. |
| 42031 |
ACTIVITY_FORCE_ RETRIED BPC.BFM.ACTIVITY. STATUS | Report | FRETRIED | Activity forcibly retried. To force activities to retry, use Business Process Choreographer Explorer. |
| 42032 |
ACTIVITY_FORCE_ COMPLETED BPC.BFM.ACTIVITY. STATUS | Stop | FCOMPLETED | Activity forcibly completed. To force activities to complete use Business Process Choreographer Explorer. |
| 42036 |
ACTIVITY_MESSAGE_ RECEIVED BPC.BFM.ACTIVITY. MESSAGE | Report | EXIT | A pick (receive choice) activity has received a message |
| 42037 |
ACTIVITY_LOOP_ CONDITION_TRUE BPC.BFM.ACTIVITY. STATUS | Report | CONDTRUE | Loop condition true |
| 42038 |
ACTIVITY_LOOP_ CONDITION_FALSE BPC.BFM.ACTIVITY. STATUS | Report | CONDFALSE | Loop condition false |
| 42039 |
ACTIVITY_WORKITEM_ DELETED BPC.BFM.ACTIVITY. WISTATUS | Report | WI_DELETED | Work item deleted. This event applies to pick, human tasks, and receive events only.
This event is emitted only when a work item is explicitly deleted by an API request. If the work item is deleted because the corresponding process instance is deleted, an event is not emitted. |
| 42040 |
ACTIVITY_WORKITEM_ CREATED BPC.BFM.ACTIVITY. WISTATUS | Report | WI_CREATED | Work items created. This event applies only to pick, human tasks, and receive events. |
| 42050 |
ACTIVITY_ESCALATED BPC.BFM.ACTIVITY. ESCALATED | Report | ESCALATED | Activity escalated. This event applies only to pick, human tasks, and receive events when the escalation associated with the human task activity is raised. |
| 42054 |
ACTIVITY_WORKITEM_ REFRESHED BPC.BFM.ACTIVITY. WISTATUS | Report | WI_REFRESHED | Activity work items refreshed. This event applies only to pick, human tasks, and receive events. |
| 42055 |
ACTIVITY_WORKITEM_ TRANSFERRED BPC.BFM.ACTIVITY. WITRANSFER | Report | WI_TRANSFERRED | Work item transferred. This event applies only to pick, human tasks, and receive events. |
| 42057 |
ACTIVITY_PARALLEL_ BRANCHES_STARTED BPC.BFM.ACTIVITY. FOREACH | Report | BRANCHES_STARTED | This event is emitted when branches are started for a forEach activity. |
| 42060 |
ACTIVITY_ CUSTOMPROPERTY_SET BPC.BFM.ACTIVITY. CUSTOMPROPERTYSET | Report | CP_SET | This event is emitted when a custom property of an activity instance is changed. |
| 42061 |
ACTIVITY_BRANCH_ CONDITION_TRUE BPC.BFM.ACTIVITY. CONDITION | Report | CONDTRUE | This event is emitted when the case condition of a choice activity evaluates to true. There is, at most, one event with the case element condition set to true for each navigated choice activity instance. That is, non-entered case elements are not honored by an event, and otherwise elements provoke the same event as condition case elements. |
| 42062 |
ACTIVITY_ALL_BRANCH_ CONDITIONS_FALSE BPC.BFM.ACTIVITY. STATUS | Report | ALLCONDFALSE | This event is emitted when no case element was used and no otherwise element exists. In this case, the navigation continues at the end of the choice construct. |
| 42063 |
ACTIVITY_JUMPED BPC.BFM.ACTIVITY. JUMPED | Report | JUMPED | This event is emitted after the final activity event of the source activity of the jump action and before the first event of the target activity. |
| 42064 |
ACTIVITY_SKIP_ REQUESTED BPC.BFM.ACTIVITY. SKIP_REQUESTED | Report | SKIP_REQUESTED | Skip activity requested. This event is emitted if the corresponding activity is not in an active state and a skip or cancelSkipRequest API is called. In this case, the request has no immediate effect on the navigation. The event contains a flag to distinguish between a skip and a cancelSkipRequest call.
The ECSCurrentID for the event to be skipped is not set to the AIID of the associated activity. |
| 42065 |
ACTIVITY_SKIPPED_ ON_REQUEST BPC.BFM.ACTIVITY. SKIPPED_ON_REQUEST | Report | SKIPPED_ON_REQUEST | Event skipped on request. This event is emitted when the navigation after an activity that is marked for skipping is continued. |
| 42069 |
ACTIVITY_TIMER_ RESCHEDULED BPC.BFM.ACTIVITY. TIMER_RESCHEDULED | Report | TIMER_RESCHEDULED | This event is emitted when a rescheduleTimer request is processed. This event can be produced for wait, human task, invoke, and pick activities. |
| 42070 |
ACTIVITY_SKIPPED_ ON_EXIT_ CONDITION BPC.BFM.ACTIVITY.SKIP_ ON_EXIT_CONDITION_TRUE | Report | SKIPPED_ON_EXIT_CONDITION_TRUE | This event is emitted when an exit condition of the onEntry type evaluates to true, and the activity is skipped for this reason. |
| 42072 |
ACTIVITY_CHILD_PROCESS_ TERMINATING BPC.BFM.ACTIVITY.CHILD_ PROCESS_TERMINATING | Report | CHILD_ PROCESS_TERMINATING | This event is emitted if the corresponding activity is an invoke activity in the running state, has a child process, and the forceRetry, forceComplete, or skip API is called or the activity expires. |
| 42073 |
ACTIVITY_CONDITION_ FORCED BPC.BFM.ACTIVITY. CONDITIONFORCED | Report | ACTIVITY_CONDITION_FORCED | An activity that has stopped because of an error evaluating a join condition was forced to continue navigating. |
| 42074 |
ACTIVITY_LOOP_ CONDITION_FORCED BPC.BFM.ACTIVITY. CONDITIONFORCED | Report | ACTIVITY_LOOP_CONDITION_FORCED | An activity that has stopped because of an error evaluating a repeat-until or while loop condition was forced to continue navigating. |
| 42075 |
ACTIVITY_FOR_EACH_ COUNTERS_FORCED BPC.BFM.ACTIVITY. COUNTERSFORCED | Report | ACTIVITY_FOR_EACH_COUNTERS_FORCED | An activity that has stopped because of an error evaluating a for-each loop condition was forced to continue navigating. |
For most activity events, the following event correlation sphere identifiers have the following content:
- The ECSCurrentID provides the ID of the activity.
- The ECSParentID provides the ID of the containing process.
For the BPC.BFM.ACTIVITY.CUSTOMPROPERTYSET and BPC.BFM.PROCESS.CUSTOMPROPERTYSET events, the ECSCurrentID is set to the process instance ID. The ECSParentID is set according to the context of the process instance.
The associatedObjectID and the associatedObjectName fields specify the activity or process instance ID or name of the associated object for these events.
Related concepts:
State transition diagrams for activities
Related reference:
Event data specific to BPEL processes
Situations in BPEL process events
Extension names for BPEL process events
Common Base Events for scope activities
Common Base Events are emitted for scope activities if monitoring is requested for these activities in IBM Integration Designer. A list of all the events that can be emitted by an activity scope can be found here. These events are also written to the audit log.
State transitions and events for scope activities
The following diagram shows the state transitions that can occur for a scope activity and the events that are emitted when these state changes take place.
Figure 1. State transitions and events for scope activities
Scope activity events
The columns in the following table contain:
- Code
- Contains the number of the event. For Business Monitor 6.0.2 format events, the value is written to the Common Base Event as an extended data element with the name BPCEventCode. For Business Monitor 6.1 format events, the value is written to the xs:any slot of the Common Base Event.
- Event name and extension name
- This column contains two values. The name of the event and the value that is set in the extensionName attribute of the Common Base Event. The extension name identifies which event specific information is contained in the Common Base Event, and it is also the name of the XML element that provides additional data about the event.
- Situation
- Refers to the situation name of the BPEL process event.
- Event nature
- A pointer to the event situation for a BPEL process element in the EventNature parameter, as they are displayed in IBM Integration Designer.
The following table describes all scope activity events.
| Code | Event name and extension name | Situation | Event nature | Description |
|---|---|---|---|---|
| 42020 |
SCOPE_STARTED BPC.BFM.ACTIVITY. STATUS | Start | ENTRY | Scope started. This event is emitted when the navigation enters the scope instance. |
| 42021 |
SCOPE_SKIPPED BPC.BFM.ACTIVITY. STATUS | Report | SKIPPED | Scope skipped. The event applies only to scope activities that have join behavior defined. The event is emitted when the join condition of the scope evaluates to false. The navigation of the process continues at the end of the scope with dead-path elimination. |
| 42022 |
SCOPE_FAILED BPC.BFM.ACTIVITY. FAILURE | Fail | FAILED | Scope failed. This event is emitted when the process navigation leaves the fault handler of the scope. |
| 42023 |
SCOPE_FAILING BPC.BFM.ACTIVITY. STATUS | Report | FAILING | Scope failing. This event is emitted when the process navigation enters the fault handling path of the scope. |
| 42024 |
SCOPE_TERMINATED BPC.BFM.ACTIVITY. STATUS | Stop | TERMINATED | Scope terminated. A scope activity can be terminated if the associated process is terminated, for example, by a terminate activity in a branch that is parallel to the scope activity. |
| 42026 |
SCOPE_COMPLETED BPC.BFM.ACTIVITY. STATUS | Stop | EXIT | Scope completed. This event is emitted when the normal navigation path of the scope and all of the activated event handler paths are completed. |
| 42043 |
SCOPE_COMPENSATING BPC.BFM.ACTIVITY. STATUS | Report | COMPENSATING | Scope compensating. This event is emitted when the process navigation enters the compensation handler, including the default compensation handler, of the scope. |
| 42044 |
SCOPE_COMPENSATED BPC.BFM.ACTIVITY. STATUS | Stop | COMPENSATED | Scope compensated. This event is emitted when the compensation handler, including default compensation handler, of the scope completes. |
| 42045 |
SCOPE_COMPENSATION_ FAILED BPC.BFM.ACTIVITY. STATUS | Fail | COMPFAILED | Scope compensation failed. This event is emitted if a fault occurs when the compensation handler for the scope runs. |
| 42048 |
SCOPE_EVENT_ RECEIVED BPC.BFM.ACTIVITY. EVENT | Report | EV_RECEIVED | This event is emitted when a new event handler instance is started for the scope. |
| 42051 |
SCOPE_EVENT_ ESCALATED BPC.BFM.ACTIVITY. ESCALATED | Report | EV_ESCALATED | Scope event escalated. This event is emitted when the escalation is started that is associated with the inline human task of an active event handler for the scope. |
| 42066 |
SCOPE_STOPPED BPC.BFM.ACTIVITY.STATUS | Stop | STOPPED | Scope is stopped. A scope instance can stop if an unhandled fault occurs during the activation or the follow-on navigation of a scope. |
| 42067 |
SCOPE_FORCE_ COMPLETED BPC.BFM.ACTIVITY. STATUS | Report | FCOMPLETED | Scope is force completed |
| 42068 |
SCOPE_FORCE_RETRIED BPC.BFM.ACTIVITY. STATUS | Report | FRETRIED | Scope has been force retried |
| 42076 |
SCOPE_CONDITION_ FORCED BPC.BFM.ACTIVITY. CONDITIONFORCED | Report | SCOPE_ CONDITION_ FORCED | An activity that has stopped because of an error evaluating a join condition was forced to continue navigating. |
Activity scope events are a type of activity event, whose syntax was described earlier for BPC.BFM.ACTIVITY.STATUS.
For activity scope events, the following event correlation sphere identifiers have the following content:
- The ECSCurrentID provides the ID of the scope.
- The ECSParentID provides the ID of the containing process.
Related reference:
Event data specific to BPEL processes
Situations in BPEL process events
Extension names for BPEL process events
Common Base Events for links in flow activities
Common Base Events for links are emitted if monitoring is requested in IBM Integration Designer for the flow activity on which the link is defined. A list of all the events that can be emitted by a link can be found here. These events are also written to the audit log.
The following types of events can be caused by links in flow activities.
Link events
The columns in the following table contain:
- Code
- Contains the number of the event. For Business Monitor 6.0.2 format events, the value is written to the Common Base Event as an extended data element with the name BPCEventCode. For Business Monitor 6.1 format events, the value is written to the xs:any slot of the Common Base Event.
- Event name and extension name
- This column contains two values. The name of the event and the value that is set in the extensionName attribute of the Common Base Event. The extension name identifies which event specific information is contained in the Common Base Event, and it is also the name of the XML element that provides additional data about the event.
- Situation
- Refers to the situation name of the BPEL process event.
- Event nature
- A pointer to the event situation for a BPEL process element in the EventNature parameter, as they are displayed in IBM Integration Designer.
The following table describes all link events.
| Code | Event name and extension name | Situation | Event nature | Description |
|---|---|---|---|---|
| 21034 |
LINK_EVALUATED_ TO_TRUE BPC.BFM.LINK.STATUS | Report | CONDTRUE | Link evaluated true |
| 42000 |
LINK_EVALUATED_ TO_FALSE BPC.BFM.LINK.STATUS | Report | CONDFALSE | Link evaluated false |
For link events, the following event correlation sphere identifiers have the following content:
- The ECSCurrentID provides the ID of the source activity of the link.
- The ECSParentID provides the ID of the containing process.
Related reference:
Event data specific to BPEL processes
Situations in BPEL process events
Extension names for BPEL process events
Common Base Events for process variables
Common Base Events are emitted for process variables if monitoring is requested for the BPEL process elements in IBM Integration Designer. A list of all the events that can be emitted by variables can be found here. These events are also written to the audit log.
The following types of events can be caused by process variables.
Variable events
The columns in the following table contain:
- Code
- Contains the number of the event. For Business Monitor 6.0.2 format events, the value is written to the Common Base Event as an extended data element with the name BPCEventCode. For Business Monitor 6.1 format events, the value is written to the xs:any slot of the Common Base Event.
- Event name and extension name
- This column contains two values. The name of the event and the value that is set in the extensionName attribute of the Common Base Event. The extension name identifies which event specific information is contained in the Common Base Event, and it is also the name of the XML element that provides additional data about the event.
- Situation
- Refers to the situation name of the BPEL process event.
- Event nature
- A pointer to the event situation for a BPEL process element in the EventNature parameter, as they are displayed in IBM Integration Designer.
The following table describes the variable events.
| Code | Event name and extension name | Situation | Event nature | Description |
|---|---|---|---|---|
| 21090 |
VARIABLE_UPDATED BPC.BFM.VARIABLE. STATUS | Report | CHANGED | Variable update. A business object payload is available. |
For the variable event, the following event correlation sphere identifiers have the following content:
- The ECSCurrentID provides the ID of the containing process.
- The ECSParentID is the ECSCurrentID before the process instance start event of the current process.
Related reference:
Event data specific to BPEL processes
Situations in BPEL process events
Extension names for BPEL process events
Situations in BPEL process events
Business process events can be emitted in different situations. The data for these situations is described in situation elements.
Business process events can contain one of the following situation elements.
| Situation name | Content of the Common Base Event | |
|---|---|---|
| Start | categoryName is set to StartSituation. | |
| situationType | ||
| Type | StartSituation | |
| reasoningScope | EXTERNAL | |
| successDisposition | SUCCESSFUL | |
| situationQualifier | START_COMPLETED | |
| Stop | categoryName is set to StopSituation. | |
| situationType | ||
| Type | StopSituation | |
| reasoningScope | EXTERNAL | |
| successDisposition | SUCCESSFUL | |
| situationQualifier | STOP_COMPLETED | |
| Destroy | categoryName is set to DestroySituation. | |
| situationType | ||
| Type | DestroySituation | |
| reasoningScope | EXTERNAL | |
| successDisposition | SUCCESSFUL | |
| Fail | categoryName is set to StopSituation. | |
| situationType | ||
| Type | StopSituation | |
| reasoningScope | EXTERNAL | |
| successDisposition | UNSUCCESSFUL | |
| situationQualifier | STOP_COMPLETED | |
| Report | categoryName is set to ReportSituation. | |
| situationType | ||
| Type | ReportSituation | |
| reasoningScope | EXTERNAL | |
| reportCategory | STATUS | |
Related reference:
Common Base Events for BPEL processes
Common Base Events for activities
Common Base Events for scope activities
Common Base Events for links in flow activities
Common Base Events for process variables
Human task events overview
Events that are emitted on behalf of human tasks consist of situation-independent data and data that is specific to human task events. The attributes and elements that are specific to human task events are described.
Human task events can have the following categories of event content.
- Event data specific to human tasks Events are created on behalf of tasks and escalations.
- Extension names for human task events The extension name indicates the payload of the human task event. A list of all the extension names for human task events and their corresponding payload can be found here.
- Human task events Human task events are sent if monitoring is requested for the elements of the task in IBM Integration Designer. Use the information provided here for a detailed description of all of the events, that is, task events and escalation events, that can be emitted by human tasks.
- Situations in human task events Human task events can be emitted in different situations. The data for these situations are described in situation elements.
Event data specific to human tasks
Events are created on behalf of tasks and escalations.
The events can have one of the following formats:
- Business Monitor 6.0.2 format
- Business Monitor 6.0.2 format events occur when there are tasks modeled in WebSphere Integration Developer 6.0.2, or if the Business Monitor 6.0.2 format is enabled in WebSphere Integration Developer 6.1, or later. If not specified otherwise, the object-specific content for these events is written as extendedDataElement XML elements of the type string.
- Business Monitor 6.1 format
- Business Monitor 6.1 format events occur when there are tasks modeled in WebSphere Integration Developer 6.1, or later, and the Business Monitor 6.1 format (XML schema support) is enabled. The object-specific content for these events is written as XML elements in the xs:any slot in the eventPointData folder of the Common Base Event. The structure of the XML is defined in the XML Schema Definition (XSD) file HTMEvents.xsd. The file can be found in the install_root\ProcessChoreographer\client directory.
Related reference:
Extension names for human task events
The extension name indicates the payload of the human task event. A list of all the extension names for human task events and their corresponding payload can be found here.
The extension name contains the string value used as the value of the extensionName attribute of the Common Base Event. This is also the name of the XML element that provides additional data about the event. The names of event elements are in uppercase, for example BPC.HTM.BASE, and the names of XML elements are in mixed case, for example, HTMEventCode. Except where indicated, all data elements are of the type string.
The following extension names are available for human task events:
- BPC.HTM.BASE
-
- BPC.HTM.ESCALATION
-
- BPC.HTM.TASK
-
BPC.HTM.BASE
BPC.HTM.BASE inherits the XML elements from WBIMonitoringEvent.
| >XML element | >Description |
|---|---|
| HTMEventCode | The Business Process Choreographer event code that identifies the number of the event type. Possible event codes are listed in the following tables. |
| activityInstanceId | The ID of the activity instance. |
| displayName | The display name of the task instance or escalation instance. |
| expirationDate | The expiration date of the task in Coordinated Universal Time (UTC) ISO 8601 format yyyyMMdd HHmmssZ. |
| isAdHoc | This has the value true if the task was created at run time. |
| isEscalated | This has the value true if the task is escalated. |
| isFollowOn | This has the value true for a follow-on task. |
| isSubTask | This has the value true for a subtask. |
| isSuspended | This has the value true if the task is suspended. |
| isWaitingForSubTask | This has the value true if the task is waiting for subtask. |
| kind | This contains one of the following values, which indicate the kind of task:
101 for a human task. 105 for a participating task. 106 for an administrative task. |
| parentTaskId | The ID of the parent task. If there is no parent task, this is left empty. |
| principal | The name of the user associated with this event. |
| processInstanceId | The ID of the process instance. |
| processTemplateId | The ID of the process template. |
| state | This contains one of the following values, which indicate the current state of the task instance.
1 - INACTIVE 2 - READY 3 - RUNNING 5 - FINISHED 6 - FAILED 7 - TERMINATE 8 - CLAIMED 12 - EXPIRED 101 - FORWARDED |
| taskInstanceId | The ID of the task instance. |
| taskTemplateId | The ID of the template. |
| taskTemplateName | The name of the task template, including the namespace. This can differ from the display name. For a subtask of a parallel routing task, this value is the name of the parent task template with the string $Child appended to it. |
| taskTemplateValidFrom | The date and time from when the task template is valid. |
BPC.HTM.ESCALATION.BASE
BPC.HTM.ESCALATION.BASE inherits the XML elements from BPC.HTM.BASE.
| >XML element | >Description |
|---|---|
| escalationName | The name of the escalation. |
| escalationInstanceDescription | The description of the escalation. |
| escalationTemplateId | The template ID of the escalation. |
BPC.HTM.ESCALATION.CUSTOMPROPERTYSET
BPC.HTM.ESCALATION.CUSTOMPROPERTYSET inherits the XML elements from BPC.HTM.ESCALATION.BASE.
| >XML element | >Description |
|---|---|
| username | The name of the user who set the custom property. |
| propertyName | The name of the custom property. |
| propertyValue | The value of the custom property. |
| associatedObjectID | The ID of the associated object that is the escalation instance ID. |
BPC.HTM.ESCALATION.STATUS
BPC.HTM.ESCALATION.STATUS inherits the XML elements from BPC.HTM.ESCALATION.BASE. No further specific properties are defined for BPC.HTM.ESCALATION.STATUS beyond the inherited properties.
BPC.HTM.ESCALATION.UPDATED
BPC.HTM.ESCALATION.UPDATED inherits the XML elements from BPC.HTM.ESCALATION.BASE.
| >XML element | >Description |
|---|---|
| durationUntilEscalated | A calendar-specific duration, after which, the task state is checked and depending on it, the escalation occurs or is superfluous. |
| durationUntilRepeated | A calendar-specific duration, after which the escalation action is performed again. |
| escalationTime | The time when this escalation will fire. |
| name | Name of the escalation. |
BPC.HTM.ESCALATION.WISTATUS
BPC.HTM.ESCALATION.WISTATUS inherits the XML elements from BPC.HTM.ESCALATION.BASE.
| >XML element | >Description |
|---|---|
| username | The names of the users who have work items that are escalated. |
| reason | The reason the work item was assigned to the user. This integer value indicates one of the following meanings:
REASON_NONE (0) REASON_POTENTIAL_OWNER (1) REASON_EDITOR (2) REASON_READER (3) REASON_OWNER (4) REASON_POTENTIAL_STARTER (5) REASON_STARTER (6) REASON_ADMINISTRATOR (7) REASON_ORIGINATOR (9) REASON_ESCALATION_RECEIVER (10) REASON_POTENTIAL_INSTANCE_CREATOR (11) |
BPC.HTM.ESCALATION.WITRANSFER
BPC.HTM.ESCALATION.WITRANSFER inherits the XML elements from BPC.HTM.ESCALATION.BASE.
| >XML element | >Description |
|---|---|
| current | The name of the current user. This is the user whose work item was transferred to someone else. |
| target | The name of the user of the work item receiver. |
| reason | The reason the work item was transferred.
This integer value indicates one of the following meanings:
REASON_NONE (0) REASON_POTENTIAL_OWNER (1) REASON_EDITOR (2) REASON_READER (3) REASON_OWNER (4) REASON_POTENTIAL_STARTER (5) REASON_STARTER (6) REASON_ADMINISTRATOR (7) REASON_ORIGINATOR (9) REASON_ESCALATION_RECEIVER (10) REASON_POTENTIAL_INSTANCE_CREATOR (11) |
BPC.HTM.TASK.BASE
BPC.HTM.TASK.BASE inherits the XML elements from BPC.HTM.BASE.
| >XML element | >Description |
|---|---|
| taskInstanceDescription | The description of the task. |
| subTaskLevel | The hierarchy level of a sub-task. The value is 1 for a first level sub-task, 2 for a second level sub-task, and so on. |
| taskInstanceName | The name of the task instance.
For inline tasks, it has a prefix consisting of the process template name and the dollar symbol. For a subtask of a parallel routing task, this value is constructed by concatenating the name of the parent task instance with the string $p and an integer that identifies the subtask, for example, parentTaskName$p5 for the fifth subtask. |
BPC.HTM.TASK.CUSTOMPROPERTYSET
BPC.HTM.TASK.CUSTOMPROPERTYSET inherits the XML elements from BPC.HTM.TASK.BASE.
| >XML element | >Description |
|---|---|
| username | The name of the user who set the custom property. |
| propertyName | The name of the custom property. |
| propertyValue | The value of the custom property. |
| associatedObjectID | The ID of the associated object that is the task instance ID. |
BPC.HTM.TASK.FAILURE
BPC.HTM.TASK.FAILURE inherits the XML elements from BPC.HTM.TASK.BASE.
| >XML element | >Description |
|---|---|
| taskFailedException | A string containing the faultNameSpace and faultName separated by a semicolon (;). |
| faultName | The name of the fault. |
BPC.HTM.TASK.FOLLOW
BPC.HTM.TASK.FOLLOW inherits the XML elements from BPC.HTM.TASK.BASE.
| >XML element | >Description |
|---|---|
| followTaskId | The ID of the task that was started as a follow-on task. |
BPC.HTM.TASK.INTERACT
BPC.HTM.TASK.INTERACT inherits the XML elements from BPC.HTM.TASK.BASE.
| >XML element | >Description |
|---|---|
| username | The name of the user that is associated with the task. |
BPC.HTM.TASK.MESSAGE
BPC.HTM.TASK.MESSAGE inherits the XML elements from BPC.HTM.TASK.BASE.
| >XML element | >Description |
|---|---|
| message or message_BO | A String or business object representation that contains the input or output message. The format depends on whether the Monitor Compatible Events option was selected on the Event Monitor tab in Integration Designer. |
BPC.HTM.TASK.STATUS
BPC.HTM.TASK.STATUS inherits the XML elements from BPC.HTM.TASK.BASE. No further specific properties are defined for BPC.HTM.TASK.STATUS beyond the inherited properties.
BPC.HTM.TASK.UPDATED
BPC.HTM.TASK.UPDATED inherits the XML elements from BPC.HTM.TASK.BASE.
| >XML element | >Description |
|---|---|
| businessRelevant | Allows you to distinguish between business relevant and "auxiliary" tasks. |
| contextAuthorizationOfOwner | Possible values are:
|
| name | The name of the task. |
| namespace | The namespace used to categorize the task. |
| description | The description of the task. |
| displayName | The display name of the task instance. |
| priority | The priority of the task. |
| type | The type used to categorize the task. |
| eventHandlerName | A Java object that handles vetoable events sent to the application component. |
| durationUntilDeleted | The time period after the task instance reaches an end state, the instance will be deleted. |
| deletionTime | Either the scheduled deletion time, or null if no deletion is scheduled. |
| durationUntilDue | A calendar-specific duration, for how long this task is expected to take. |
| dueTime | The time when the task is expected to be finished. |
| durationUntilExpires | A calendar-specific duration, after which the task will expire. |
| expirationTime | The actual date when this task will expire. |
| escalated | Indicated whether an escalation occurred for this task. |
| parentContextID | The parent context for this task. This is the ID the task is dependant on.
|
| supportsClaimIfSuspended | Indicates whether suspended tasks can be claimed. |
| supportsDelegation | Indicates whether this task can be delegated. |
| supportsFollowOnTasks | Indicates whether following tasks are supported. |
| supportsSubTasks | Indicates whether sub-tasks can be invoked for this task. |
BPC.HTM.TASK.WISTATUS
BPC.HTM.TASK.WISTATUS inherits the XML elements from BPC.HTM.TASK.BASE.
| >XML element | >Description |
|---|---|
| username | The names of the users who have work items that were created or deleted. |
| reason | The reason the work item was assigned to the user. This integer value indicates one of the following meanings:
REASON_NONE (0) REASON_POTENTIAL_OWNER (1) REASON_EDITOR (2) REASON_READER (3) REASON_OWNER (4) REASON_POTENTIAL_STARTER (5) REASON_STARTER (6) REASON_ADMINISTRATOR (7) REASON_ORIGINATOR (9) REASON_ESCALATION_RECEIVER (10) REASON_POTENTIAL_INSTANCE_CREATOR (11) |
BPC.HTM.TASK.WITRANSFER
BPC.HTM.TASK.WITRANSFER inherits the XML elements from BPC.HTM.TASK.BASE.
| >XML element | >Description |
|---|---|
| current | The name of the current user. This is the user whose work item was transferred to someone else. |
| target | The name of the user of the work item receiver. |
| reason | The reason the work item was transferred.
This integer value indicates one of the following meanings:
REASON_NONE (0) REASON_POTENTIAL_OWNER (1) REASON_EDITOR (2) REASON_READER (3) REASON_OWNER (4) REASON_POTENTIAL_STARTER (5) REASON_STARTER (6) REASON_ADMINISTRATOR (7) REASON_ORIGINATOR (9) REASON_ESCALATION_RECEIVER (10) REASON_POTENTIAL_INSTANCE_CREATOR (11) |
Related reference:
Human task events
Human task events are sent if monitoring is requested for the elements of the task in IBM Integration Designer. Use the information provided here for a detailed description of all of the events, that is, task events and escalation events, that can be emitted by human tasks.
An event is emitted when the state of a task changes. The following types of events can be caused by human tasks:
For tasks that were created at run time, events are only emitted if the business relevance flag is set to true in the task model.
Inline tasks can emit both human task events and activity events. For a list of the activity events, see Common Base Events for activities.
All human task events can be emitted in both the CEI and the audit trail, with the exception of the task template events. The task template events TASK_TEMPLATE_INSTALLED and TASK_TEMPLATE_UNINSTALLED can only be emitted in the audit trail.
XML Schema Definition (XSD) files
The structure of the events that are sent to CEI is described in the following schema definition file install_root\ProcessChoreographer\client\HTMEvents.xsd
Key to table columns
The columns in the following tables contain:
- Code
- Contains the number of the event. For Business Monitor 6.0.2 format events, the value is written to the Common Base Event as an extended data element with the name HTMEventCode. For Business Monitor 6.1 format events, the value is written to the xs:any slot of the Common Base Event.
- Event name and extension name
- This column contains two values. The name of the event and the value that is set in the extensionName attribute of the Common Base Event. The extension name identifies which event specific information is contained in the Common Base Event, and it is also the name of the XML element that provides additional data about the event.
If WebSphere Business Integration Modeler is used to create the underlying task model, the extension name for events that contain message data in their payload can be extended by a hash character (#) followed by additional characters. These additional characters are used to distinguish Common Base Events that carry different message objects. Events that emit message data also contain additional nested extendedDataElements in order to report the contents of the data object. Refer to the documentation for WebSphere Business Integration Modeler for more information.
- Situation
- Refers to the situation name of the human task event. For details of situations, see Situations in human task events.
- Event nature
- A pointer to the event situation for a BPEL process element in the EventNature parameter, as they are displayed in Integration Designer.
Task events
The following table describes all task events.
| Code | Event name and extension name | Situation | Event nature | Description |
|---|---|---|---|---|
| 51001 |
TASK_CREATED BPC.HTM.TASK. INTERACT | Report | CREATED | Task created |
| 51002 |
TASK_DELETED BPC.HTM.TASK.STATUS | Destroy | DELETED | Task deleted |
| 51003 |
TASK_STARTED BPC.HTM.TASK.STATUS | Start | ENTRY | Task started |
| 51004 |
TASK_COMPLETED BPC.HTM.TASK.STATUS | Stop | EXIT | Task completed |
| 51005 |
TASK_CLAIM_ CANCELLED BPC.HTM.TASK.STATUS | Report | DEASSIGNED | Claim canceled |
| 51006 |
TASK_CLAIMED BPC.HTM.TASK. INTERACT | Report | ASSIGNED | Task claimed |
| 51007 |
TASK_TERMINATED BPC.HTM.TASK.STATUS | Stop | TERMINATED | Task terminated |
| 51008 |
TASK_FAILED BPC.HTM.TASK. FAILURE | Fail | FAILED | Task failed |
| 51009 |
TASK_EXPIRED BPC.HTM.TASK.STATUS | Report | EXPIRED | Task expired |
| 51010 |
TASK_WAITING_FOR_ SUBTASK BPC.HTM.TASK.STATUS | Report | WAITFORSUBTASK | Waiting for subtasks |
| 51011 |
TASK_SUBTASKS_ COMPLETED BPC.HTM.TASK.STATUS | Stop | SUBTASKCOMPLETED | Subtasks completed |
| 51012 |
TASK_RESTARTED BPC.HTM.TASK.STATUS | Report | RESTARTED | Task restarted |
| 51013 |
TASK_SUSPENDED BPC.HTM.TASK.STATUS | Report | SUSPENDED | Task suspended |
| 51014 |
TASK_RESUMED BPC.HTM.TASK.STATUS | Report | RESUMED | Task resumed |
| 51015 |
TASK_COMPLETED_ WITH_FOLLOW_ON BPC.HTM.TASK. FOLLOW | Report | COMPLETEDFOLLOW | Task completed and follow-on task started |
| 51101 |
TASK_UPDATED BPC.HTM.TASK.UPDATED | Report | UPDATED | Task updated |
| 51102 |
TASK_INPUT_MESSAGE_ UPDATED BPC.HTM.TASK. MESSAGE | Report | INPUTSET | Input message updated. Business object payload is available. |
| 51103 |
TASK_OUTPUT_ MESSAGE_UPDATED BPC.HTM.TASK. MESSAGE | Report | OUTPUTSET | Output message updated. Business object payload is available. |
| 51104 |
TASK_FAULT_ MESSAGE_UPDATED BPC.HTM.TASK. MESSAGE | Report | FAULTSET | Fault message updated. Business object payload is available. |
| 51201 |
TASK_WORKITEM_ DELETED BPC.HTM.TASK. WISTATUS | Destroy | WI_DELETED | Work item deleted |
| 51202 |
TASK_WORKITEM_ CREATED BPC.HTM.TASK. WISTATUS | Report | WI_CREATED | Work items created |
| 51204 |
TASK_WORKITEM_ TRANSFERRED BPC.HTM.TASK. WITRANSFER | Report | WI_TRANSFERRED | Work item transferred |
| 51205 |
TASK_WORKITEM_ REFRESHED BPC.HTM.TASK. WISTATUS | Report | WI_REFRESHED | Work items refreshed |
| 51301 |
TASK_CUSTOMPROPERTY_ SET BPC.HTM.TASK. CUSTOMPROPERTYSET | Report | CP_SET | Custom property set. This event is generated when a custom property of a task instance is changed. |
| 52001 |
TASK_TEMPLATE_ INSTALLED | Report | INSTALLED | These are task template events, which are only emitted in the audit trail. They are not emitted as common base events, and are included here for completeness. |
| 52002 |
TASK_TEMPLATE_ UNINSTALLED | Report | UNINSTALLED | These are task template events, which are only emitted in the audit trail. They are not emitted as common base events, and are included here for completeness. |
For task events, the following identifiers of event correlation spheres have the following content:
- The ESCcurrentID provides the ID of the task instance.
- The ECSParentID is the ECSCurrentID before the task instance event.
Escalation events
The following table describes all task escalation events.
| Code | Event name and extension name | Situation | Event nature | Description |
|---|---|---|---|---|
| 53001 |
ESCALATION_UPDATED BPC.HTM.ESCALATION.UPDATED | Report | UPDATED | Escalation updated |
| 53201 |
ESCALATION_WORKITEM_DELETED BPC.HTM.ESCALATION.WISTATUS | Destroy | WI_DELETED | Work item deleted |
| 53202 |
ESCALATION_WORKITEM_CREATED BPC.HTM.ESCALATION.WISTATUS | Report | WI_CREATED | Work item created |
| 53204 |
ESCALATION_WORKITEM_TRANSFERRED BPC.HTM.ESCALATION.WITRANSFER | Report | WI_TRANSFERRED | Escalation transferred |
| 53205 |
ESCALATION_WORKITEM_REFRESHED BPC.HTM.ESCALATION.WISTATUS | Report | WI_REFRESHED | Work item refreshed |
| 51302 |
ESCALATION_CUSTOMPROPERTY_SET BPC.HTM.ESCALATION.CUSTOMPROPERTYSET | Report | CP_SET | Custom property set. This event is generated when a custom property of an escalation instance is changed. |
For task events, the following identifiers of event correlation spheres have the following content:
- The ESCcurrentID provides the ID of the escalation.
- The ECSParentID provides the ID of the associated task instance.
Related concepts:
State transition diagrams for activities
Related reference:
Event data specific to human tasks
Extension names for human task events
Situations in human task events
Situations in human task events
Human task events can be emitted in different situations. The data for these situations are described in situation elements.
Human task events can contain one of the following situation elements.
| Situation name | Content of the Common Base Event | |
|---|---|---|
| Start | categoryName is set to StartSituation. | |
| situationType | ||
| Type | StartSituation | |
| reasoningScope | EXTERNAL | |
| successDisposition | SUCCESSFUL | |
| situationQualifier | START_COMPLETED | |
| Stop | categoryName is set to StopSituation. | |
| situationType | ||
| Type | StopSituation | |
| reasoningScope | EXTERNAL | |
| successDisposition | SUCCESSFUL | |
| situationQualifier | STOP_COMPLETED | |
| Destroy | categoryName is set to DestroySituation. | |
| situationType | ||
| Type | DestroySituation | |
| reasoningScope | EXTERNAL | |
| successDisposition | SUCCESSFUL | |
| Fail | categoryName is set to StopSituation. | |
| situationType | ||
| Type | StopSituation | |
| reasoningScope | EXTERNAL | |
| successDisposition | UNSUCCESSFUL | |
| situationQualifier | STOP_COMPLETED | |
| Report | categoryName is set to ReportSituation. | |
| situationType | ||
| Type | ReportSituation | |
| reasoningScope | EXTERNAL | |
| reportCategory | STATUS | |
Related reference:
IBM Business Process Manager Advanced events
IBM Business Process Manager features its own service components, and each of these components has its own set of event points that can be monitored.
Service components contain one or more elements, which are sets of different steps processed in each service component. In turn, each element has its own set of event natures, that are key points that are reached when processing a service component element. All service components, their elements and associated event natures, and the extended data elements unique to each event are listed.
- Resource Adapter events The event types available for the resource adapter component are listed.
- Binding events The event types available for the BPM bindings (JMS, JAX-WS, HTTP, EJB, and EIS) are listed.
- Business rule events The event types available for the business rule component are listed.
- Business state machine events The event types available for the business state machine component are listed.
- Map events The event types available for the map component are listed.
- Mediation events The event types available for the mediation component are listed.
- Recovery events The event types available for the recovery component are listed.
- Service Component Architecture events The event types available for the Service Component Architecture are listed.
- Selector events The event types available for the Selector component are listed.
Resource Adapter events
The event types available for the resource adapter component are listed.
The elements of the resource adapter component (base name eis:WBI.JCAAdapter) that can be monitored are listed here, along with their associated event natures, event names, and the extended data elements that are unique to each event.
| Event Name | Event Natures | Event Contents | Type |
|---|---|---|---|
| InboundEventRetrieval element | |||
| eis:WBI.JCAAdapter.InboundEventRetrieval.ENTRY | ENTRY | pollQuantity | int |
| status | int | ||
| eventTypeFilters | string | ||
| eis:WBI.JCAAdapter.InboundEventRetrieval.EXIT | EXIT | N/A | |
| eis:WBI.JCAAdapter.InboundEventRetrieval.FAILURE | FAILURE | FailureReason | exception |
| InboundEventDelivery element | |||
| eis:WBI.JCAAdapter.InboundEventDelivery.ENTRY | ENTRY | N/A | |
| eis:WBI.JCAAdapter.InboundEventDelivery.EXIT | EXIT | N/A | |
| eis:WBI.JCAAdapter.InboundEventDelivery.FAILURE | FAILURE | FailureReason | exception |
| Outbound element | |||
| eis:WBI.JCAAdapter.Outbound.ENTRY | ENTRY | N/A | |
| eis:WBI.JCAAdapter.Outbound.EXIT | EXIT | N/A | |
| eis:WBI.JCAAdapter.Outbound.FAILURE | FAILURE | FailureReason | exception |
| InboundCallbackAsyncDeliverEvent element | |||
| eis:WBI.JCAAdapter.InboundCallbackAsyncDeliverEvent.ENTRY | ENTRY | N/A | |
| eis:WBI.JCAAdapter.InboundCallbackAsyncDeliverEvent.EXIT | EXIT | N/A | |
| eis:WBI.JCAAdapter.InboundCallbackAsyncDeliverEvent.FAILURE | FAILURE | FailureReason | exception |
| InboundCallbackSyncDeliverEvent element | |||
| eis:WBI.JCAAdapter.InboundCallbackSyncDeliverEvent.ENTRY | ENTRY | N/A | |
| eis:WBI.JCAAdapter.InboundCallbackSyncDeliverEvent.EXIT | EXIT | N/A | |
| eis:WBI.JCAAdapter.InboundCallbackSyncDeliverEvent.FAILURE | FAILURE | FailureReason | exception |
| Polling element | |||
| eis:WBI.JCAAdapter.Polling.STARTED | STARTED | PollFrequency | int |
| PollQuantity | int | ||
| eis:WBI.JCAAdapter.Polling.STOPPED | STOPPED | N/A | |
| Delivery element | |||
| eis:WBI.JCAAdapter.Delivery.EXIT | EXIT | N/A | |
| eis:WBI.JCAAdapter.Delivery.FAILURE | FAILURE | EventID | string |
| FailureReason | exception | ||
| Retrieval element | |||
| eis:WBI.JCAAdapter.Retrieval.FAILURE | FAILURE | EventID | string |
| FailureReason | exception | ||
| Endpoint element | |||
| eis:WBI.JCAAdapter.Endpoint.FAILURE | FAILURE | FailureReason | exception |
| Recovery element | |||
| eis:WBI.JCAAdapter.Recovery.EXIT | EXIT | N/A | |
| eis:WBI.JCAAdapter.Recovery.FAILURE | FAILURE | FailureReason | exception |
| EventFailure element | |||
| eis:WBI.JCAAdapter.EventFailure.FAILURE | FAILURE | FailureReason | exception |
| Connection element | |||
| eis:WBI.JCAAdapter.Connection.FAILURE | FAILURE | FailureReason | exception |
Binding events
The event types available for the BPM bindings (JMS, JAX-WS, HTTP, EJB, and EIS) are listed.
All binding events contain a single element, with a base prefix name of binding:WBI.SCA.*. The event structure is described in the XML Schema Definition (XSD) file SCABindingEvents.xsd. The file can be found in the $WAS_HOME/plugins/com.ibm.ws.sca.bindingcore.jar/model directory.
To enable the monitor event framework, open the following trace:
WBIEventMonitor.CEI.SCABinding.*=all: WBIEventMonitor.LOG.SCABinding.*=all Events for the JMS, JAX-WS, HTTP, EJB, and EIS bindings are listed in the sections that follow.
JMS binding
| Event Name | Event Nature | Event Contents | Type |
|---|---|---|---|
| WBI.SCA.JMSBINDING.ENTRY | ENTRY | MODULE_NAME | string |
| BINDING_NAME | string | ||
| OPERATION_NAME | string | ||
| BINDING_TYPE | string restriction: import and export | ||
| BINDING_PROTOCOL | string restriction: JMS | ||
| DESTINATION | string | ||
| REPLY_DESTINATION | string | ||
| CALLBACK_DESTINATION | string | ||
| DIRECTION | string restriction: REQUEST, RESPONSE | ||
| JMS_TYPE | string restriction: SIBus, GenericJMS, MQJMS, MQNative | ||
| DATABINDING_NAME | string | ||
| MESSAGE_ID | string | ||
| CORRELATION_ID | string | ||
| WBI.SCA.JMSBINDING.EXIT | EXIT | MODULE_NAME | string |
| BINDING_NAME | string | ||
| OPERATION_NAME | string | ||
| BINDING_TYPE | string restriction: import and export | ||
| BINDING_PROTOCOL | string restriction: JMS | ||
| DESTINATION | string | ||
| REPLY_DESTINATION | string | ||
| CALLBACK_DESTINATION | string | ||
| DIRECTION | string restriction: REQUEST, RESPONSE | ||
| JMS_TYPE | string restriction: SIBus, GenericJMS, MQJMS, MQNative | ||
| DATABINDING_NAME | string | ||
| MESSAGE_ID | string | ||
| CORRELATION_ID | string | ||
| WBI.SCA.JMSBINDING.FAILURE | FAILURE | MODULE_NAME | string |
| BINDING_NAME | string | ||
| OPERATION_NAME | string | ||
| BINDING_TYPE | string restriction: import and export | ||
| BINDING_PROTOCOL | string restriction: JMS | ||
| DESTINATION | string | ||
| REPLY_DESTINATION | string | ||
| CALLBACK_DESTINATION | string | ||
| DIRECTION | string restriction: REQUEST, RESPONSE | ||
| JMS_TYPE | string restriction: SIBus, GenericJMS, MQJMS, MQNative | ||
| DATABINDING_NAME | string | ||
| MESSAGE_ID | string | ||
| CORRELATION_ID | string | ||
| Exception | string |
For an example of JMS binding event code, see the related links at the end of this topic.
JAX-WS binding
Events associated with the JAX-WS binding, along with the extended data elements that are unique to each event, are listed in Table 2.
| Event Name | Event Nature | Event Contents | Type |
|---|---|---|---|
| WBI.SCA.JAXWSBINDING.ENTRY | ENTRY | MODULE_NAME | string |
| BINDING_NAME | string | ||
| OPERATION_NAME | string | ||
| BINDING_TYPE | string restriction: import and export | ||
| BINDING_PROTOCOL | string restriction: JAX-WS | ||
| SERVICE_QNAME | string | ||
| PORT_QNAME | string | ||
| ENDPOINT | string | ||
| WBI.SCA.JAXWSBINDING.EXIT | EXIT | MODULE_NAME | string |
| BINDING_NAME | string | ||
| OPERATION_NAME | string | ||
| BINDING_TYPE | string restriction: import and export | ||
| BINDING_PROTOCOL | string restriction: JAX-WS | ||
| SERVICE_QNAME | string | ||
| PORT_QNAME | string | ||
| ENDPOINT | string | ||
| WBI.SCA.JAXWSBINDING.FAILURE | FAILURE | MODULE_NAME | string |
| BINDING_NAME | string | ||
| OPERATION_NAME | string | ||
| BINDING_TYPE | string restriction: import and export | ||
| BINDING_PROTOCOL | string restriction: JAX-WS | ||
| SERVICE_QNAME | string | ||
| PORT_QNAME | string | ||
| ENDPOINT | string | ||
| Exception | string |
HTTP binding
Events associated with the HTTP binding, along with the extended data elements that are unique to each event, are listed in Table 3.
| Event Name | Event Nature | Event Contents | Type |
|---|---|---|---|
| WBI.SCA.HTTPBINDING.ENTRY | ENTRY | MODULE_NAME | string |
| BINDING_NAME | string | ||
| OPERATION_NAME | string | ||
| BINDING_TYPE | string restriction: import and export | ||
| BINDING_PROTOCOL | string restriction: HTTP | ||
| ENDPOINT | string | ||
| HTTPMETHOD | string | ||
| WBI.SCA.HTTPBINDING.EXIT | EXIT | MODULE_NAME | string |
| BINDING_NAME | string | ||
| OPERATION_NAME | string | ||
| BINDING_TYPE | string restriction: import and export | ||
| BINDING_PROTOCOL | string restriction: HTTP | ||
| ENDPOINT | string | ||
| HTTPMETHOD | string | ||
| WBI.SCA.HTTPBINDING.FAILURE | FAILURE | MODULE_NAME | string |
| BINDING_NAME | string | ||
| OPERATION_NAME | string | ||
| BINDING_TYPE | string restriction: import and export | ||
| BINDING_PROTOCOL | string restriction: HTTP | ||
| ENDPOINT | string | ||
| HTTPMETHOD | string | ||
| Exception | string |
EJB binding
Events associated with the EJB binding, along with the extended data elements that are unique to each event, are listed in Table 4.
| Event Name | Event Nature | Event Contents | Type |
|---|---|---|---|
| WBI.SCA.EJBBINDING.ENTRY | ENTRY | MODULE_NAME | string |
| BINDING_NAME | string | ||
| OPERATION_NAME | string | ||
| BINDING_TYPE | string restriction: import and export | ||
| BINDING_PROTOCOL | string restriction: EJB | ||
| JNDI_NAME | string | ||
| DATABINDING_NAME | string | ||
| WBI.SCA.EJBBINDING.EXIT | EXIT | MODULE_NAME | string |
| BINDING_NAME | string | ||
| OPERATION_NAME | string | ||
| BINDING_TYPE | string restriction: import and export | ||
| BINDING_PROTOCOL | string restriction: EJB | ||
| JNDI_NAME | string | ||
| DATABINDING_NAME | string | ||
| WBI.SCA.EJBBINDING.FAILURE | FAILURE | MODULE_NAME | string |
| BINDING_NAME | string | ||
| OPERATION_NAME | string | ||
| BINDING_TYPE | string restriction: import and export | ||
| BINDING_PROTOCOL | string restriction: EJB | ||
| JNDI_NAME | string | ||
| DATABINDING_NAME | string | ||
| Exception | string |
EIS binding
Events associated with the EIS binding, along with the extended data elements that are unique to each event, are listed in Table 5.
| Event Name | Event Nature | Event Contents | Type |
|---|---|---|---|
| WBI.SCA.EISBINDING.ENTRY | ENTRY | MODULE_NAME | string |
| BINDING_NAME | string | ||
| OPERATION_NAME | string | ||
| BINDING_TYPE | string restriction: import and export | ||
| BINDING_PROTOCOL | string restriction: EIS | ||
| RESOURCE_ADAPTER | string | ||
| WBI.SCA.EISBINDING.EXIT | EXIT | MODULE_NAME | string |
| BINDING_NAME | string | ||
| OPERATION_NAME | string | ||
| BINDING_TYPE | string restriction: import and export | ||
| BINDING_PROTOCOL | string restriction: EIS | ||
| RESOURCE_ADAPTER | string | ||
| WBI.SCA.EISBINDING.FAILURE | FAILURE | MODULE_NAME | string |
| BINDING_NAME | string | ||
| OPERATION_NAME | string | ||
| BINDING_TYPE | string restriction: import and export | ||
| BINDING_PROTOCOL | string restriction: EIS | ||
| JNDI_NAME | string | ||
| RESOURCE_ADAPTER | string | ||
| Exception | string |
- Generic JMS binding event code example Here is a sample of the code for a generic JMS binding event.
Related reference:
Performance Monitoring Infrastructure statistics
Generic JMS binding event code example
Generic JMS binding event code example
Here is a sample of the code for a generic JMS binding event.
Generic JMS binding event
<wbi:event
xmlns:wbi="http://www.ibm.com/xmlns/prod/websphere/monitoring/6.1"
xmlns:xsi="http://www.w3.org/2001/XMLSchema-instance" xmlns:xsd="http://www.w3.org/2001/XMLSchema"
xmlns:binding="http://www.ibm.com/xmlns/prod/websphere/scdl/6.0.0:Binding">
<wbi:eventHeaderData>
<wbi:WBISESSION_ID>9.115.71.147;TestGenJMSClt;Import1;operation3;1311156316324;520298243</wbi:WBISESSION_ID>
<wbi:ECSCurrentID>9.115.71.147;TestGenJMSClt;TestIntfPartner;Import1;operation3;1311156316324;520298243
</wbi:ECSCurrentID>
<wbi:ECSParentID>9.115.71.147;TestGenJMSClt;Import1;operation3;1311156316324;520298243</wbi:ECSParentID>
<wbi:WBIEventVersion>6.1</wbi:WBIEventVersion>
</wbi:eventHeaderData>
<wbi:eventPointData xsi:type="binding:WBI.SCA.JMSBINDING.EXIT">
<wbi:eventNature>EXIT</wbi:eventNature>
<wbi:payloadType>bogus</wbi:payloadType>
<binding:MODULE_NAME>TestGenJMSClt</binding:MODULE_NAME>
<binding:BINDING_NAME>Import1</binding:BINDING_NAME>
<binding:OPERATION_NAME>operation3</binding:OPERATION_NAME>
<binding:BINDING_TYPE>Import</binding:BINDING_TYPE>
<binding:BINDING_PROTOCOL>JMS</binding:BINDING_PROTOCOL>
<binding:DESTINATION>queue:///BDRQ?version=6</binding:DESTINATION>
<binding:REPLY_DESTINATION>queue:///BDSQ?version=6</binding:REPLY_DESTINATION>
<binding:CALLBACK_DESTINATION>queue://TestGenJMSClt.Import1_GENJMS_CALLBACK_D_SIB?busName
=SCA.SYSTEM.WIN-1OPBE8FWO28Node01Cell.Bus</binding:CALLBACK_DESTINATION>
<binding:DIRECTION>REQUEST</binding:DIRECTION>
<binding:JMS_TYPE>GenericJMS</binding:JMS_TYPE>
<binding:DATABINDING_NAME>com.ibm.wsspi.sca.jms.data.JMSDataHandlerBindingImpl</binding:DATABINDING_NAME>
<binding:MESSAGE_ID>ID:414d5120513238382020202020202020637c264e20034307</binding:MESSAGE_ID>
<binding:CORRELATION_ID>ID:414d5120513238382020202020202020637c264e20034307</binding:CORRELATION_ID>
</wbi:eventPointData>
</wbi:event>
Related reference:
Business rule events
The event types available for the business rule component are listed.
The business rule component (base name br:WBI.BR) contains a single element that can be monitored. All event types for this element are listed here, with their associated event natures, event names, and the extended data elements that are unique to each event.
| Event Name | Event Nature | Event Contents | Type |
|---|---|---|---|
| br:WBI.BR.ENTRY | ENTRY | operationName | string |
| br:WBI.BR.EXIT | EXIT | operationName | string |
| br:WBI.BR.FAILURE | FAILURE | ErrorReport | Exception |
| operationName | string | ||
| br:WBI.BR.SelectionKeyExtracted | SelectionKeyExtracted | operationName | string |
| br:WBI.BR.TargetFound | TargetFound | operationName | string |
| target | string |
Business state machine events
The event types available for the business state machine component are listed.
The elements from the business state machine component (base name bsm:WBI.BSM) that can be monitored are listed here, along with their associated event natures, event names, and all extended data elements that are unique to each event.
| Event Name | Event Nature | Event Contents | Type |
|---|---|---|---|
| StateMachineDefinition element | |||
| bsm:WBI.BSM.StateMachineDefinition.ALLOCATED | ALLOCATED | instanceID | string |
| bsm:WBI.BSM.StateMachineDefinition.RELEASED | RELEASED | instanceID | string |
| Transition element | |||
| bsm:WBI.BSM.Transition.ENTRY | ENTRY | instanceID | string |
| name | string | ||
| bsm:WBI.BSM.Transition.EXIT | EXIT | instanceID | string |
| name | string | ||
| bsm:WBI.BSM.Transition.FAILURE | FAILURE | ErrorReport | Exception |
| instanceID | string | ||
| name | string | ||
| State element | |||
| bsm:WBI.BSM.State.ENTRY | ENTRY | instanceID | string |
| name | string | ||
| bsm:WBI.BSM.State.EXIT | EXIT | instanceID | string |
| name | string | ||
| bsm:WBI.BSM.State.FAILURE | FAILURE | ErrorReport | Exception |
| instanceID | string | ||
| name | string | ||
| Guard element | |||
| bsm:WBI.BSM.Guard.ENTRY | ENTRY | instanceID | string |
| name | string | ||
| bsm:WBI.BSM.Guard.EXIT | EXIT | instanceID | string |
| name | string | ||
| result | boolean | ||
| bsm:WBI.BSM.Guard.FAILURE | FAILURE | ErrorReport | Exception |
| instanceID | string | ||
| name | string | ||
| Action element | |||
| bsm:WBI.BSM.Action.ENTRY | ENTRY | instanceID | string |
| name | string | ||
| bsm:WBI.BSM.Action.EXIT | EXIT | instanceID | string |
| name | string | ||
| bsm:WBI.BSM.Action.FAILURE | FAILURE | ErrorReport | Exception |
| instanceID | string | ||
| name | string | ||
| EntryAction element | |||
| bsm:WBI.BSM.EntryAction.ENTRY | ENTRY | instanceID | string |
| name | string | ||
| bsm:WBI.BSM.EntryAction.EXIT | EXIT | instanceID | string |
| name | string | ||
| bsm:WBI.BSM.EntryAction.FAILURE | FAILURE | ErrorReport | Exception |
| instanceID | string | ||
| name | string | ||
| ExitAction element | |||
| bsm:WBI.BSM.ExitAction.ENTRY | ENTRY | instanceID | string |
| name | string | ||
| bsm:WBI.BSM.ExitAction.EXIT | EXIT | instanceID | string |
| name | string | ||
| bsm:WBI.BSM.ExitAction.FAILURE | FAILURE | ErrorReport | Exception |
| instanceID | string | ||
| name | string | ||
| Timer element | |||
| bsm:WBI.BSM.Timer.START | START | instanceID | string |
| name | string | ||
| duration | string | ||
| bsm:WBI.BSM.Timer.STOPPED | STOPPED | instanceID | string |
| name | string | ||
| duration | string | ||
Map events
The event types available for the map component are listed.
The elements from the map component (base name map:WBI.MAP) that can be monitored are listed here, along with their event natures, event names, and all extended data elements that are unique to each event.
| Event Name | Event Nature | Event Contents | Type |
|---|---|---|---|
| map:WBI.MAP.ENTRY | ENTRY | N/A | N/A |
| map:WBI.MAP.EXIT | EXIT | N/A | N/A |
| map:WBI.MAP.FAILURE | FAILURE | FailureReason | Exception |
| Transformation element | |||
| map:WBI.MAP.Transformation.ENTRY | ENTRY | N/A | N/A |
| map:WBI.MAP.Transformation.EXIT | EXIT | N/A | N/A |
| map:WBI.MAP.Transformation.FAILURE | FAILURE | FailureReason | Exception |
Mediation events
The event types available for the mediation component are listed.
The elements from the mediation component (base name ifm:WBI.MEDIATION) that can be monitored are listed here, along with their associated event natures, names, and all extended data elements that are unique to each event.
| Event Name | Event Nature | Event Contents | Type |
|---|---|---|---|
| OperationBinding element | |||
| ifm:WBI.MEDIATION.OperationBinding.ENTRY | ENTRY | InteractionType | string |
| TicketID | string | ||
| Source | string | ||
| Target | string | ||
| ifm:WBI.MEDIATION.OperationBinding.EXIT | EXIT | InteractionType | string |
| TicketID | string | ||
| Source | string | ||
| Target | string | ||
| ifm:WBI.MEDIATION.OperationBinding.FAILURE | FAILURE | InteractionType | string |
| TicketID | string | ||
| Source | string | ||
| Target | string | ||
| ErrorReport | Exception | ||
| ParameterMediation element | |||
| ifm:WBI.MEDIATION.ParameterMediation.ENTRY | ENTRY | Type | string |
| TransformName | string | ||
| ifm:WBI.MEDIATION.ParameterMediation.EXIT | EXIT | Type | string |
| TransformName | string | ||
| ifm:WBI.MEDIATION.ParameterMediation.FAILURE | FAILURE | Type | string |
| TransformName | string | ||
| ErrorReport | Exception | ||
Recovery events
The event types available for the recovery component are listed.
The recovery component (base name recovery:WBI.Recovery) contains a single element that can be monitored. All event types for this element are listed here, along with their associated event natures, event names, and the extended data elements that are unique to each event.
| Event Name | Event Nature | Event Contents | Type |
|---|---|---|---|
| recovery:WBI.Recovery.FAILURE | FAILURE | MsgId | string |
| DestModuleName | string | ||
| DestComponentName | string | ||
| DestMethodName | string | ||
| SourceModuleName | string | ||
| SourceComponentName | string | ||
| ResubmitDestination | string | ||
| ExceptionDetails | string | ||
| SessionId | string | ||
| FailureTime | dateTime | ||
| ExpirationTime | dateTime | ||
| Status | int | ||
| MessageBody | byteArray | ||
| Deliverable | boolean | ||
| recovery:WBI.Recovery.DEADLOOP | DEADLOOP | DeadloopMsgId | string |
| SIBusName | string | ||
| QueueName | string | ||
| Reason | string | ||
| recovery:WBI.Recovery.RESUBMIT | RESUBMIT | MsgId | string |
| OriginalMesId | string | ||
| ResubmitCount | int | ||
| Description | string | ||
| recovery:WBI.Recovery.DELETE | DELETE | MsgId | string |
| deleteTime | dateTime | ||
| Description | string |
Service Component Architecture events
The event types available for the Service Component Architecture are listed.
The Service Component Architecture (SCA) contains a single element, with a base name of sca:WBI.SCA.MethodInvocation. All the events and associated natures of this element are listed here, along with all extended data elements and that are unique to each event.
Do not confuse these events with SCA-specific Application Response Measurement (ARM) performance statistics.
| Event Name | Event Nature | Event Contents | Type |
|---|---|---|---|
| WBI.SCA.MethodInvocation.ENTRY | ENTRY | SOURCE COMPONENT | string |
| SOURCE INTERFACE | string | ||
| SOURCE METHOD | string | ||
| SOURCE MODULE | string | ||
| SOURCE REFERENCE | string | ||
| TARGET COMPONENT | string | ||
| TARGET INTERFACE | string | ||
| TARGET METHOD | string | ||
| TARGET MODULE | string | ||
| WBI.SCA.MethodInvocation.EXIT | EXIT | SOURCE COMPONENT | string |
| SOURCE INTERFACE | string | ||
| SOURCE METHOD | string | ||
| SOURCE MODULE | string | ||
| SOURCE REFERENCE | string | ||
| TARGET COMPONENT | string | ||
| TARGET INTERFACE | string | ||
| TARGET METHOD | string | ||
| TARGET MODULE | string | ||
| WBI.SCA.MethodInvocation.FAILURE | FAILURE | SOURCE COMPONENT | string |
| SOURCE INTERFACE | string | ||
| SOURCE METHOD | string | ||
| SOURCE MODULE | string | ||
| SOURCE REFERENCE | string | ||
| TARGET COMPONENT | string | ||
| TARGET INTERFACE | string | ||
| TARGET METHOD | string | ||
| TARGET MODULE | string | ||
| Exception | string |
Related reference:
Performance Monitoring Infrastructure statistics
Selector events
The event types available for the Selector component are listed.
The selector component contains a single element that can be monitored. All event types for this element are listed here, along with their associated event natures, event names, and the extended data elements that are unique to each event. All selector events have a base name of sel:WBI.SEL.
| Event Name | Event Nature | Event Contents | Type |
|---|---|---|---|
| sel:WBI.SEL.ENTRY | ENTRY | operationName | string |
| sel:WBI.SEL.EXIT | EXIT | operationName | string |
| sel:WBI.SEL.FAILURE | FAILURE | ErrorReport | Exception |
| operationName | string | ||
| sel:WBI.SEL.SelectionKeyExtracted | SelectionKeyExtracted | operationName | string |
| sel:WBI.SEL.TargetFound | TargetFound | operationName | string |
| target | string |
Simulating and optimizing processes
IBM Business Process Manager Optimizer is a tool designed to help you understand and refine the process models that you develop in BPM.
BPM Optimizer enables you to:
- Simulate your processes while you are developing them to understand how well those process models might perform.
BPM Optimizer runs simulations using estimates that you provide for staffing levels, activity execution times, and so on. Simulating your processes during development enables you to test and refine process designs before implementation.
- Analyze your processes after they are up and running using historical data stored in the Business Performance Data Warehouse.
For each process, with autotracking enabled, you can measure actual execution, wait, and other times. You can also track the values of specific business data (process variables) as they move through each step in a process. Running historical analyses using BPM Optimizer enables you to measure and then improve the efficiency of your processes.
The Optimizer provides a variety of analysis scenarios, ranging from simple simulations to validate your overall process modeling strategy to advanced what-if comparative analyses.
| BPM Optimizer enables you to... | Benefit |
|---|---|
| Simulate process performance | Understand process design issues that could affect performance before process implementation |
| Identify bottlenecks and other issues | Optimize processes already in production |
| Compare actual process performance to simulations | Analyze how well your processes are doing compared to the goals set |
| Compare simulations to historical performance data | Analyze what would happen if you made specific changes to your processes |
| Simultaneously analyze multiple processes from a single or multiple process applications |
|
- Configuration requirements for simulation When you want to run simulations, you have to go through a certain number of tasks.
- Configuration requirements for optimization To optimize your processes, configure BPM to capture data.
- Run simulations, historical analyses, and comparisons
- Review results After you have gathered enough results, you can display them in different ways.
- Sample simulations Before you implement a process, simulations can help you pinpoint potential issues such as bottlenecks caused by resource constraints or a particular path being taken more often than is optimal.
- Sample historical analyses and comparisons
Configuration requirements for simulation
When you want to run simulations, you have to go through a certain number of tasks.
If you are developing process models and want to perform simulations using IBM Business Process Manager Optimizer in the order shown.
You can quickly run a simulation for a single process using default simulation values. To do so, open the process in Process Designer and click Playback > Simulate (Single) Process in the main menu.
| Task | Description |
|---|---|
| Set up simulation profiles |
For each item in a process model, provide estimates for task duration, probabilities for gateways, and other values on which to base your simulations. BPM provides a default simulation profile that you can use or you can create one or more new profiles. The advantage of profiles is they let you specify and save different estimates for specific situations that you know might occur in the environment. |
| Set team simulation properties | For each team, provide estimated capacity, availability, efficiency, and cost per hour. BPM provides a default capacity and cost per hour for each team, but you should adjust these settings before running simulations to reflect the workload in the environment. |
| Create simulation analysis scenarios |
Set the process models to include, the simulation properties and values (simulation profile) to use for each included process, the number of instances to simulate, and other values. The advantage of simulation scenarios is they enable you to group and compare performance for different sets of processes. |
- Set up simulation profiles When you run a simulation, the results are based on the settings that you establish in a simulation profile.
- Set simulation properties for teams Before running simulations, you should set the simulation properties for the teams assigned to the swimlanes in the process models that you are analyzing. Doing so ensures the simulation results reflect the performance expectations for the teams in your organization.
- Create simulation analysis scenarios You can create simulation analysis scenarios and store them in the BPM library. When you define a simulation analysis scenario, you provide information the Optimizer requires such as the processes to include in the simulation, the simulation properties and values (simulation profile) for each process, and so on.
Set up simulation profiles
When you run a simulation, the results are based on the settings that you establish in a simulation profile.
You do not need to create a simulation profile to run a simulation. IBM Business Process Manager includes a default simulation profile that provides default simulation values.
- Open a process (BPD) in Process Designer and click the Diagram tab.
- Click the Start event in the diagram to select it.
- Click Simulation in the Properties tab.
- Under Simulation Profile, click New to create a new profile or click Select to select an existing profile. The simulation values that you provide for each item in your process are saved with the simulation profile that is selected.
When you select a simulation profile for one item in a process, that profile automatically becomes the selected profile for all other items in the process.
- Select the Event is simulated in this profile check box.
- Under Firing Delay, set a distribution type and then establish how often the process is initiated for simulation purposes. For example, if the distribution type is Fixed and the set value is 10 minutes, the Optimizer simulates the process starts exactly every 10 minutes. With a uniform or normal distribution type, you can establish averages and ranges so the timing of the process kick-off deviates and is not so precise, which might more accurately reflect the environment.
- Set simulation properties for each activity in the process. Click an activity in the diagram to select it.
- Click Simulation in the Properties tab.
- Under Execution Time, in the Distribution Type list, select either Fixed, Uniform, or Normal.
If you select... Specify... BPM Optimizer... Fixed The execution time in days, hours, and minutes. Uses the same specified value each time. Uniform The average execution time and the range (average plus or minus the values specified) in days, hours, and minutes. Is equally likely to use each value in the specified range. Normal The average execution time, the range (average plus or minus the values specified), and the standard deviation in days, hours, and minutes. Is more likely to use values within the specified range that are closer to the specified average instead of values that are more or less than the average. - You can select whether to include activities that are contained in linked processes and subprocesses in your simulations.
- If an activity is a linked process activity, select the Simulate linked process check box and then choose the simulation profile to use for the linked process. If you do not want to include the linked process in the simulation, clear the Simulate linked process check box. Simulation does not drill-down into your linked process and it does not simulate the activities the linked process contains. It treats the linked process activity as an activity with no implementation.
- If the activity is a subprocess or an event subprocess, select the Simulate subprocess check box. If you do not select the Simulate subprocess check box,
simulation treats the subprocess activity as an activity with no implementation.
Simulation does not drill-down into your subprocess and it does not simulate the activities the subprocess contains. For event subprocesses,
if you do not select the Simulate subprocess check box, the event subprocess are not triggered during simulation.
The triggering of an event subprocess is based on the Firing Delay settings of the start event in the event subprocess. When an event subprocess is triggered, the parent process is stopped while the event subprocess runs, and then resumes after the event subprocess completes.
- For each event in the process, indicate whether to simulate the event and, if so, specify the firing delay.
The firing delay determines when the Optimizer initiates the event. For example, a fixed firing delay of 15 minutes for an attached message event means the Optimizer simulates the process as if that message event fires 15 minutes after the start of the associated activity and, if the event is repeatable and the associated activity is not closed, every 15 minutes after the initial firing.
Events that are attached to an activity include a Firing condition option so that you can choose between a timed delay and a delay that depends on the percentage of completed activities.
- For each decision Gateway, Split, and Join, indicate the probability of the runtime process flowing from the gateway in one direction rather than another. The probability is expressed in percentage for each attached sequence line.
You can create multiple simulation profiles for a single process. When you create or edit a simulation analysis scenario, you can choose which of the simulation profiles to use for the current scenario.
If you run a simulation for a single BPD by choosing Playback > Simulate (Single) Process from the main menu, BPM uses the currently selected simulation profile in the Simulation properties. If a profile is not set, BPM uses the default simulation profile.
Set simulation properties for teams
Before running simulations, you should set the simulation properties for the teams assigned to the swimlanes in the process models that you are analyzing. Doing so ensures the simulation results reflect the performance expectations for the teams in your organization.
To set simulation properties for teams:
- In Process Designer, open a team involved in the processes to simulate.
- Under Simulation properties, provide the following information:
Field or control Description Capacity In the drop-down list, choose either Use Estimated Capacity or Use Provider Users. If you select Use Estimated Capacity, enter the maximum number of users that this team can include in the associated field. If you select Use Provider Users, IBM Business Process Manager sets the capacity so that it is equal to the number of members in the team. Availability Set the percentage of working hours of this team that are available to complete BPM tasks resulting from the processes you are analyzing. Efficiency Set the efficiency of this team as a percentage. Cost per Hour Provide the cost (in dollars and cents) to your organization for each hour of work performed by this team. - Click the Save icon in the main toolbar.
Create simulation analysis scenarios
You can create simulation analysis scenarios and store them in the BPM library. When you define a simulation analysis scenario, you provide information the Optimizer requires such as the processes to include in the simulation, the simulation properties and values (simulation profile) for each process, and so on.
To create simulation analysis scenarios:
- In Process Designer, expand Processes and select Simulation
Analysis Scenario from the list of components.
- Enter a name for the scenario and click Finish.
- In the Scenarios editor, provide the following information:
Window area Field or control Description Common Documentation Optionally provide a description in this field. Simulation Data Filters Start Time Use the calendar and clock counter to indicate a start time for the scenario. Limit running time Click this option to limit the simulated running time for the processes included in the analysis. If so, provide the running time in days, hours, and minutes. Limit process instances Click this option to limit the number of process instances the simulation runs. If so, select the process and then provide the number of instances. Processes Apps to Include in Analysis To choose the process applications that you want from the BPM repository, click Add (BPM lists the process applications to which you have read access.) Choose the process applications that contain the processes to analyze.
Be sure to select the correct snapshot (version) to analyze. Select (Current) to analyze the current working version. To remove a process application, click the application name and then click Remove.
If you select multiple snapshots (versions) to analyze, the first version listed in the table determines the team definition used. Use the Up and Down buttons to change the order of the process applications if you know you want to use the team definition from a different version for your scenario.
Processes to Include in Analysis To choose the processes to analyze, click Add. (BPM lists the BPDs residing in the selected process applications.) If the Simulation Profile associated with the process that you choose is not the profile that you want, click the name of the profile in the right column, which enables you to choose another profile using a drop-down menu. If no profiles have been defined, only the Default profile is available. To remove a process, click the process name and then click Remove. Team Overrides Add/Remove Click Add to choose one or more of the teams from the selected process applications. Then change the values to override, such as the capacity, cost per hour, and so on. (In the Capacity column you can type +value or -value to increase or decrease the capacity by a certain number of participants. You can also type just a value to specify an absolute capacity such as 10.)
This table enables you to run a scenario with different settings for your participants without changing the actual team definitions, which can help you simulate different workloads. To remove overrides, click a team name and then click Remove.
If you specify Team Overrides for multiple teams and a member belongs to one or more of those teams, that member uses the simulation overrides specified for the first team in the table. To change the order of the teams in the Team Overrides table, use the Up and Down buttons.
You may now run a simulation using a defined scenario.
Configuration requirements for optimization
To optimize your processes, configure BPM to capture data.
Use historical data captured by IBM Business Process Manager Business Performance Data Warehouse, the Optimizer pinpoints areas in your process models where you can make design changes to help streamline execution and, thus, improve performance. If you are planning to deploy one or more processes and you want to capture the performance data that will enable you to optimize those processes in the order shown:
| Task | Description |
|---|---|
| Ensure autotracking is enabled | With autotracking enabled, BPM captures data that automatically includes tracking points at the entry and exit of each item in a process definition (such as activities and gateways). This data enables the Optimizer to analyze runtime task duration as well as compare how a process performs when it follows one path versus another. |
| Set the business data (variables) to track | To capture the value of business data at every point as it flows through the process, specify the variables to track. Doing so ensures that you get the most value out of your process analysis. For example, knowing which of your suppliers is causing the most exceptions in your quality assurance process is valuable information. |
| Send tracking definitions | The data described in the preceding tasks is captured to the Business Performance Data Warehouse only if you send tracking definitions as instructed in the following procedures. |
| Create historical analysis scenarios | After your processes have been running for a while and you want to analyze the collected data using the Optimizer, create historical scenarios to specify the process models to include, the business data (variables) by which to filter the analysis results, and whether to include only completed or also currently running process instances. The advantage of historical scenarios is they enable you to group and compare performance for different sets of processes. |
Optional configuration for optimization
BPM provides the following configuration options for the Optimizer, which may prove useful or helpful in the environment:
| Option | Description |
|---|---|
| Generate historical data | You can set up a Simulation Profile and generate historical data based on that profile to run historical analyses based on data that you generate. This option is helpful to simulate your processes using business data versus the timing data that is normally available with simulations. |
| Analyze data from Business Performance Data Warehouses in runtime environments | You can configure BPM to enable the Optimizer to performs its analysis on the data from Business Performance Data Warehouses in runtime environments. This option is helpful to be able to select a Business Performance Data Warehouse other than the local warehouser when running an analysis. |
- Tracking performance data for the Optimizer You configure Process Designer to track performance data and send it to the Performance Data Warehouse.
- Create historical analysis scenarios When you define a historical analysis scenario, you provide information the Optimizer requires such as the processes to include, the business data (variables) by which to filter the analysis results, and whether to include only completed or also currently running process instances.
- Analyzing data from Business Performance Data Warehouses in runtime environments When using the Optimizer, you can run your historical analyses using data from any of the Business Performance Data Warehouses in your IBM Business Process Manager configuration. For example, if you have several runtime environments (development, staging, test, and production) in which your processes are running, you can choose to analyze processes using the stored data from those environments.
- Generating historical data It is possible to generate historical data with an IBM Business Process Manager utility to help you simulate processes using business data versus the timing data that is normally available with simulations.
Tracking performance data for the Optimizer
You configure Process Designer to track performance data and send it to the Performance Data Warehouse.
To track performance data, ensure that autotracking is enabled, specify the business data to track, and then send the tracking definitions to the Business Performance Data Warehouse.
Use autotracking
Autotracking is enabled by default. You can open the process diagram in Process Designer, click the Tracking tab, and then select the Enable Autotracking check box in the Properties tab. Because to add variables to track so that you can analyze performance data according to particular business variable values, enter an autotracking name in the Tracking tab.
BPM uses the autotracking name to create a view in the Business Performance Data Warehouse database to hold the tracked data.
Specifying the business data to track
To specify the business data (variables) to track, go to the Variables tab for your process, right-click each variable to track, and then click Track this Variable.
BPM creates a column in the view for each tracked variable, using the variable name that is shown in the Tracked Short Name field.
At a minimum, track the following data:
- The unique identifiers within the process that represent keys in your system of record data.
- The data to analyze, such as customer name, customer segment, product type, or request type.
- Values that you expect to change during a process. For example, in a financial dispute process, you can track the approved amount of the dispute as the dispute moves through the process.
Sending tracking definitions to the Performance Data Warehouse
After you enable autotracking and specify the variables to track, save the process and then send your newly defined tracking requirements to the Business Performance Data Warehouse. From the BPM main menu, select File > Update Tracking Definitions.
Send tracking definitions whenever you change your process diagrams or when you change the tracking or business data in your processes, including creating or editing scenarios.
When you install process application snapshots in a runtime environment, the Process Server in that environment automatically sends tracking definitions to its corresponding Business Performance Data Warehouse.
Create historical analysis scenarios
When you define a historical analysis scenario, you provide information the Optimizer requires such as the processes to include, the business data (variables) by which to filter the analysis results, and whether to include only completed or also currently running process instances.
To create a historical analysis scenario:
- In Process Designer, expand Processes and select Historical Analysis Scenario from the list of components.
- name for the scenario and click Finish.
- In the Scenarios editor, provide the following information:
Window area Field or control Description Common Documentation Optionally provide a description in this field. Historical Data Filters Include Process Instances By default, the All option is enabled, which means that data for both completed and currently running process instances is analyzed by the Optimizer. To create analyze data for only currently running process instances, select In-Flight Only. To create analyze data for only completed process instances, select Completed Only. Time Range Select a time range for the data the Optimizer will analyze such as Last Week. Select Custom to use the calendars to pick a Start and End Date. Process Apps to Include in Analysis Click Add to choose the process applications that you want from the BPM repository. Choose the process applications that contain the processes to analyze. Be sure to select the correct snapshot (version) to analyze.
To create analyze all versions, select the snapshot named (All) for the process application that you want. To remove a process application, click the application name and click Remove.
If you do not add any process applications to this table, all process applications in the BPM repository to which you have read access are included, which means that you can analyze processes from any of those applications. If you select multiple snapshots (versions) to analyze, the first version listed in the table determines the team definition used. You can use the Up and Down buttons to change the order of the process applications if you know you want to use the team definition from a different version for your scenario.
Processes to Include in Analysis Click Add to choose the processes that you want. The processes available are the ones residing in the process applications that you added in the preceding table. To remove a process, click the process name and then click Remove. Be sure to add subprocesses so that you can drill down during analysis.
If you do not add any processes to this table, all processes residing in the process applications that you added in the preceding table are analyzed.
Business Data Click Add to select the tracked variables by which you want to filter the results of this scenario. The variable names that you add must be tracked variables for each of the processes included in this scenario.
If a process included in the scenario does not have a matching tracked variable for each variable name that you add here, no instances of that process will be returned in the analysis results. Choose an operator using the drop-down list in the Comparison column and then enter a value to compare in the Value field. To remove a variable, click the variable name and then click Remove.
Analyzing data from Business Performance Data Warehouses in runtime environments
When using the Optimizer, you can run your historical analyses using data from any of the Business Performance Data Warehouses in your IBM Business Process Manager configuration. For example, if you have several runtime environments (development, staging, test, and production) in which your processes are running, you can choose to analyze processes using the stored data from those environments. The following must be true in order to analyze processes using data from a Business Performance Data Warehouse in a runtime environment:
- Process servers in runtime environments must be connected to the Process Center.
- You must meet the configuration requirements in order for optimization to run your historical analyses.
-
BPM must be tracking and storing data in the Business Performance Data Warehouse in the runtime environment.
When you install process application snapshots in a runtime environment, the Process Server in that environment automatically sends tracking definitions to its corresponding Business Performance Data Warehouse. After definitions are sent and process instances are up and running, you can analyze data for those processes in that runtime environment using the Optimizer.
When you meet the requirements listed earlier in this topic, the Optimizer includes a menu for the runtime servers connected to the Process Center.
To analyze data from runtime environments.
- Open the Optimizer.
- Click the menu shown in the following image to choose the runtime environment that you want.

- Run your historical analysis. The results displayed reflect the performance data from the environment that you chose in step 2.
The Optimizer enables you to analyze data from one warehouse at a time.
Generating historical data
It is possible to generate historical data with an IBM Business Process Manager utility to help you simulate processes using business data versus the timing data that is normally available with simulations.
Normally, you would run instances of your processes in a production environment for some time in order to generate and store meaningful performance data in the Business Performance Data Warehouse.
Before generating historical data, be sure to use autotracking, specify the business data (variables) to track, and send tracking definitions to the Business Performance Data Warehouse. To generate historical data using a simulation analysis scenario:
- From the BPM library, double-click a simulation analysis scenario to open it. For this procedure, use the Case Management sample scenario. In the scenario, notice that you are generating data for one version of a process called Billing Disputes. The Optimizer generates data as if 100 instances of the process actually ran, to match the Max instances setting in this scenario. You can learn more about the Billing Disputes sample process when you review the sample simulations.
If you select multiple versions in the Simulation Analysis Scenario window, this utility generates data for all of the versions that you include. However, in the generated data, you cannot specify different data per version. To generate different data per version, run the utility and alter the data as needed for each version.
- From the BPM main menu, click Scenario > Generate Historical Data.
- In the Generate Historical Data from Simulation window box, set the Instance and Task ID values to previously unused ranges (this is necessary in order to avoid data overwrites where data has been previously generated for the selected scenario). If this is the first time data has been generated for this scenario, you do not need to change these values.
- Accept the default Business Performance Data Warehouse option as the Destination for generated data to go ahead and edit the local XML file that BPM generates. Click File to save initial data to the local XML file, open and edit the XML file in your favorite editor, and then come back to this window box later to generate and send the historical data to the Performance Data Warehouse.
- Click the Edit xml file link to edit the local XML file by providing specific values for the steps in the process included in your scenario. If the XML file exists, the Optimizer opens the file. If the file does not exist, the Optimizer creates a file, and then opens it.
The XML file has the same name as the simulation analysis scenario that you are using to generate historical data. In the previous example, you can see all the data that will be tracked, including the default Key Performance Indicators (KPIs) and the tracked fields for the process included in the sample scenario (Billing Disputes).
- Scroll through the XML file and provide values to initialize
the data for each activity and flow component in the process.
- For example, you can initialize the customer name for the Gather Dispute Information activity using standard JavaScript as shown in the following example.
<flowObject id='bpdid:5e6cd2e3efad952:29c8c36a:1138c758934:-7f5c' name='Start'>
</flowObject>
<flowObject id='bpdid:5e6cd2e3efad952:29c8c36a:1138c758934:-7f4d' name='Gather Dispute Information'>
  <!--Activity-->
  <!--<assignTo>'bpd Online Call Center West'</assignTo>-->
  <var name='name'>
  var arr = new Array('BJR Supplies', "Majestic', 'ABC Inc', 'Acme');
  arr[Math.floor(Math.random()*arr.length)];
  </var>
 </flowObject>
The JavaScript randomly iterates through the names in the supplied array. - You can provide a simple calculation to determine the totalActualAmount and totalRequestAmount for the Gather Dispute Information activity.
<var name='totalActualAmount'>
   500 + Math.floor(75 * (Math.random()-.5));
</var>

<var name='totalRequestAmount'>
   500 + Math.floor(75 * (Math.random()-.5));
</var>
- You can also establish the process flow. For example, you can provide algorithms to determine the values for variables like researchRequired and approvalRequired as shown in the following example.
<var name='researchRequired'> var s; if (Math.random() < .90) {s = 'Yes';} else {s = 'No';} s; </var> <var name='approvalRequired'> var s; if (Math.random() < .60) {s = 'Yes';} else {s = 'No';} s; </var> - You can specify the flow of the process according to values of these variables. Scroll down to the gateways and indicate what should happen for each condition. As in the following example, you can establish what should happen for the Yes condition for the Research Required gateway.
<flowObject id='bpdid:5e6cd2e3efad952:29c8c36a:1138c758934:-7be4' name='ResearchRequired?'>
  <!--Gateway 1, conditions needed:1-->
  <conditions>
   <condition name='Yes'  bpmnId='bpdid:5e6cd2e3efad952:29c8c36a:1138c758934:-7be4'
   researchRequired=='Yes'</condition>
  </conditions>
</flowObject>
<flowObject id='bpdid:fc87b608e236270a:-6209de48:113b7dd45d9:-7beb' name='Researching'>
</flowObject>
<flowObject id='bpdid:fc87b608e236270a:-6209de48:113b7dd45d9:-7beb' name='Submitted'>
</flowObject>
- For example, you can initialize the customer name for the Gather Dispute Information activity using standard JavaScript as shown in the following example.
- When your edits are complete and you are ready to generate and send data to the Business Performance Data Warehouse, click Finish.
If you're simulating a large number of instances (for example, 50,000 instances) generating historical data can take up to 10-15 minutes per scenario. If you notice slower performance, do not perform any other work while this utility is running.
BPM Optimizer generates historical data using the specifications from the simulation analysis scenario and the values from the XML file and sends the data to the Business Performance Data Warehouse. (Be sure to set the Performance Data Warehouse as the destination when you are ready to generate and send data.)
If you change the structure of the processes that you are analyzing or if you change the processes included in the simulation analysis scenario, you must delete the existing XML file before generating historical data for the revised processes or scenario.
After the data is sent to the Business Performance Data Warehouse, you can perform historical analyses for the included processes.
Run simulations, historical analyses, and comparisons
- Before you begin Before you begin.
- Run scenarios In the Optimizer, you can run scenarios or compare them. The Optimizer generates a chart with the results you need.
Before you begin
Before you begin.
- Complete the configuration tasks required to run simulations.
- Complete the configuration tasks required to run historical analyses and comparisons.
- Access the Optimizer by selecting Optimizer from the menu at the top of Process Designer.
To see all views in the Optimizer, including the Smart Start view and the Recommendations view, select Full from the list in the lower-left corner of Process Designer as shown in the preceding image. Select Simple from the list to hide the Smart Start and Recommendations views.
Run scenarios
In the Optimizer, you can run scenarios or compare them. The Optimizer generates a chart with the results you need.
To run scenarios:
- Select the mode that you want from the list in the Analysis
Scenarios view. Available modes include:
Mode Description Single Simulation Simulate the processes included in the simulation analysis scenario that you select in the following step. Simulation vs. Simulation Simulate and compare the processes in one simulation analysis scenario to those in another scenario per your selections in the following step. Single Historical Analyze the stored performance data for the processes included in the historical analysis scenario that you select in the following step. Historical vs. Historical Analyze and compare the stored performance data for the processes in one historical analysis scenario to those in another scenario per your selections in the following step. Historical vs. Simulation (How did I do) Compare the stored performance data for the processes in the historical analysis scenario to the simulations for the processes in the simulation analysis scenario per your selections in the following step. Simulation vs. Historical (What if) Compare the simulations for the processes in the simulation analysis scenario to the stored performance data for the processes in the historical analysis scenario per your selections in the following step. You can also run historical analyses using data from other configured environments.
- To select the analysis scenarios to run, click Select beneath Selected Scenarios. If you are running a comparative analysis, you must select a baseline scenario (B) and a sample scenario (A) to compare to the baseline.
- To see a list of available modes, in the Heat
Map Settings view, click the currently displayed visualization
mode.
Visualization modes enable you to establish the criteria for the heat maps and live reports the Optimizer generates for the processes included in your scenarios.
The Optimizer displays wait time, execution time, and total time only for the activities that generate end-user tasks. The Optimizer does not display wait time, execution time, or total time for activities that are implemented using subprocesses.
By default, the KPI thresholds used by the visualization modes are the thresholds from the current working version of your process application or toolkit.
To use the KPI thresholds from the snapshot (version) of your process application or toolkit that was most recently run and tracked, change the Optimizer preference setting (for KPI threshold values) to: Use the KPI threshold values from the actual version of the Process App/Toolkit. You can access preference settings from the main Process Designer File menu: Preferences > IBM Business Process Manager > Optimizer.
- Select the visualization mode that you want from the list:
Mode Description Wait Time Measures the time that elapses between BPM generating a task, and a user opening that task. For example, the amount of time that a task sits in a user's inbox in IBM Process Portal before it is opened is considered wait time. Execution Time Measures the time that elapses between a user opening a task, and then completing and closing that task. For example, the amount of time that it takes a user to enter required data on a Coach form is considered execution time. Total Time Measures the time that elapses between BPM generating a task, and a user closing that task (wait time + execution time). Efficiency Compares the expected execution time established in the execution time key Performance Indicator (KPI) to the actual execution time. For example, if the actual execution time for a task is 2 hours and the expected execution time set in the execution time KPI is 4 hours, the Optimizer displays an efficiency of 200%. You can set KPIs in the KPI tab for each activity. If you don't set values for each field in a KPI, BPM uses default values. You can open each KPI to see the default values.
Waiting Activities Displays the count or total volume of tasks generated by BPM that have not yet been opened by a user. Executing Activities Displays the count or total volume of tasks generated by BPM that have been opened by a user. Completed Activities Displays the count or total volume of tasks generated by BPM that have been closed by a user. Happy Path Shows how often the happy paths (best case routes) through a process are taken. Exception Path Shows how often exception paths (alternative routes) through a process are taken. Path Displays results for all paths (Happy Path + Exception Path). SLA Displays results based on Service Level Agreement (SLA) violations. Rework Displays results based on Activities that violate the Rework KPI. By default, an Activity is considered rework if it is run more than once during a process instance. You can change the default settings for the Rework KPI in the KPI tab for each Activity. When you are running in a non-comparison mode (single simulation or single historical ) while viewing resulting heat maps, items highlighted in red are problematic. When you are running in a comparison mode, items highlighted in blue represent the sample scenario (A) and items highlighted in red represent the baseline scenario (B).
- Edit the settings for the visualization mode that you select.
For example, if you select Wait Time, set the measure, value, and scale that you want from the following specification:
Use measure, show me value, scaled from days:hours:minutes to days:hours:minutes.
The selections for measure include:
Measure Description Clock Time Includes all elapsed time. Calendar Time Includes only business hours from the elapsed time. The selections for value include:
Value Description % of instances outside of range Shows the percent of process instances outside the activity threshold or fixed range that you designate. (You can designate activity thresholds using the KPIs tab in the Process Modeler's properties.) Average value Shows the average wait times within the scale that you designate. Total value Shows the total wait times within the scale that you designate. For the scale, you can specify the low and then high values of the range of wait times for which you want to check. For the wait time mode, specify the range in days, hours, and minutes.
- In the Analysis Scenarios view, click Calculate.
Examine the results of the analysis.
Review results
After you have gathered enough results, you can display them in different ways.
IBM Business Process Manager Optimizer presents analysis results in:
- Heat maps
- Live reports
- Recommendations
- Smart Start hotspots
To see all views in the Optimizer, including the Smart Start view and the Recommendations view, click Full from the drop-down menu in the lower-left corner of Process Designer.
The following sections describe how to interpret these results.
- Review heat map results The Optimizer displays a color-coded heat map to visually illustrate where bottlenecks and other problems exist in the processes included in your scenario, and how severe those issues are. The darker the halo around an activity, the closer it is to the high end of the scale or range that you specified in the Heatmap Settings view.
- Review Live Reports results The data displayed in the Live Reports view depends upon the current editor and selection. For example, if you are examining a heat-mapped process diagram and you have selected an activity in that diagram, the Live Reports view shows data specific to that activity.
- Review recommendations To get recommendations for a problematic Activity or other element in a process, click an element with a halo around it in the heat map. The Recommendations view makes practical recommendations for addressing issues that are identified in your processes, and suggestions for how to optimize your process models.
- Review results in the Smart Start view The Smart Start view directs you to the activities and processes that deserve a closer look based on the most recently run analysis scenario and the current visualization mode. It provides direct access to hotspots identified by the Optimizer when you run an analysis scenario, as well as processes and teams included in the most recently run analysis scenario.
Review heat map results
The Optimizer displays a color-coded heat map to visually illustrate where bottlenecks and other problems exist in the processes included in your scenario, and how severe those issues are. The darker the halo around an activity, the closer it is to the high end of the scale or range that you specified in the Heatmap Settings view.
You can see details about the data used to render the heat map color coding by mousing over an activity that is surrounded by a halo. When you do, the Optimizer displays relevant data in easy to read charts and graphs. These same charts and graphs are also included in the Live Reports view.
For simulations, the Optimizer uses the default simulation data or the simulation values that you provided when creating simulation profiles to show you where bottlenecks are likely to occur. For historical analyses and comparisons, the Optimizer uses stored performance data to indicate problem areas in your processes.
To display heat maps for other processes in the scenario, you can use the Smart Start view. Click an activity shown in the Hotspot list to go directly to the process in which that problematic activity resides. You can also click a process name shown in the Scenario Scope. However, some processes included in the scenario may not produce issues (halos around activities) or show results per the current visualization mode. See the related links at the end of this topic.
Review Live Reports results
The data displayed in the Live Reports view depends upon the current editor and selection. For example, if you are examining a heat-mapped process diagram and you have selected an activity in that diagram, the Live Reports view shows data specific to that activity.
The following figure shows a live report for a process. To view such a report, click twice in any blank area away from components such as activities or gateways in a heat-mapped process diagram. (If you click in any blank area in a heat-mapped process diagram, the current lane is selected.)

A live report for a process includes the sections shown in the preceding figure. The first two charts illustrate duration data for the instances of this process and the final pie chart shows all processes the users involved in this process worked on.
When you run a comparative analysis, the first two charts include data in red and blue where blue represents the performance of the favorable scenario.
The other sections and information include:
| Section | Information provided |
|---|---|
| Instance Analysis | Shows the number of executing and completed instances as well as duration. |
| KPI Analysis | Provides information regarding the Key Performance Indicators (KPIs) tracked for each activity in this process. |
| Activity Analysis | Displays data for each activity in the process, including the number of waiting, executing and completed activities, and the minimum, maximum, and average waiting and execution times for each activity. |
The following figure shows a live report for an activity. To view such a report, click an activity in a heat-mapped process diagram.
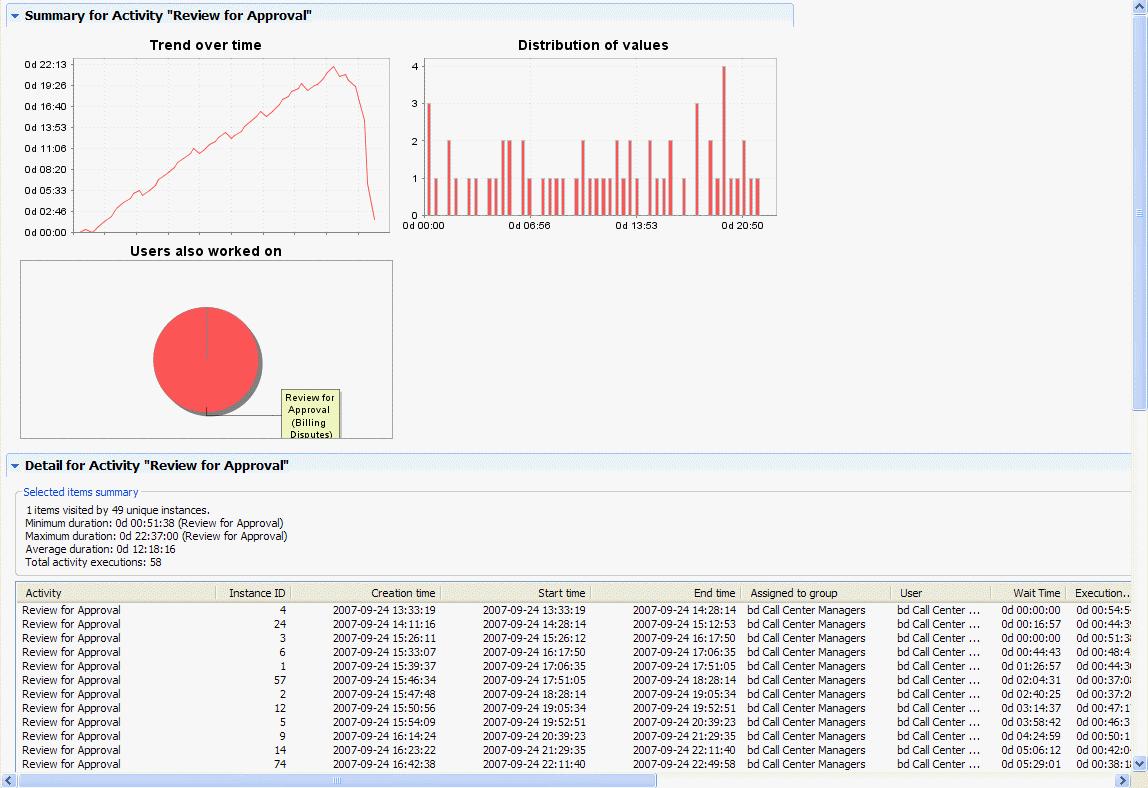
The first two charts displayed in a live report for an activity are the same charts that you see when you move your mouse on an activity in a heat-mapped process diagram. The final pie chart shows all activities the users for this activity worked on.
The Details table for the activity includes different columns of information, depending on which visualization mode is currently set. For the example report shown in the preceding figure, the visualization mode is Wait Time.
You can click other elements in your process diagram to see live report data for those elements. For example, if you click a path from a gateway, the live report view shows the process instances that followed that path.
When you select multiple activities or other process elements in a process diagram, the detail table in the Live Reports view includes data for each selected element. The same is true when you select a swim lane in a process diagram. Selecting a swim lane causes the Live Reports view to show data for each process element in that lane.
When you run a comparative analysis, such as Simulation versus Simulation, the Live Reports view shows two Detail tables: one for Scenario A and another for Scenario B.
The Details table in a live report includes only the first 1,000 rows of available data. However, when you open the report in Microsoft Excel, all rows are included. To open a report in Microsoft Excel, click the Microsoft Excel icon at the top of the report.
Review recommendations
To get recommendations for a problematic Activity or other element in a process, click an element with a halo around it in the heat map. The Recommendations view makes practical recommendations for addressing issues that are identified in your processes, and suggestions for how to optimize your process models.
The recommendations might encourage you to examine other visualization modes to gain a better understanding of a particular pattern or behavior in your processes. Resolving identified issues can involve questions such as:
- Would different resource allocations resolve my current bottlenecks? (Time and resource consumption)
- Are my processes taking the paths that I expect them to? What changes will ensure they do? (Path optimization)
- How are my largest loan applications going through the process? How does that compare to my smaller loan applications? Why are very large loan applications always late? (Segment optimization)
Some recommendations are presented with a cheat sheet that guides you through performing the recommended actions, step by step. To open the cheat sheet, click Guide Me. Other recommendations provide instructions for refining your analysis or suggestions for improving process performance, such as prioritizing tasks, training resources, and so on.
The data displayed in the Recommendations view depends upon the current editor and selection. For example, if you run a scenario, the Recommendations view initially instructs you to select a haloed element or investigate hotspots. The preceding image shows an example of what the Recommendations view looks like after running an Analysis Scenario and then selecting a highlighted activity in a heat-mapped process diagram.
The cheat sheets in the Recommendations view provide three types of interactive help:
| Type of interactive help | Description |
|---|---|
| Tell Me | Provides step-by-step instructions for completing a task within the Process Designer graphical interface. |
| Show Me | Provides step-by-step instructions that include actions to take you to the part of the interface where steps are performed. |
| Do It For Me | Provides help actions which, when clicked, perform a task or parts of a task for you. |
The example in the preceding image shows the recommendations for an Activity that is bottlenecked. Review all the recommendations to determine which action would best address the bottlenecks for the Activity. For example, you may not have the option to add more resources to the Activity, so you would consider other alternatives that are presented in the Recommendations view.
Some recommendations might include using the Guided Optimization Wizard.
Review results in the Smart Start view
The Smart Start view directs you to the activities and processes that deserve a closer look based on the most recently run analysis scenario and the current visualization mode. It provides direct access to hotspots identified by the Optimizer when you run an analysis scenario, as well as processes and teams included in the most recently run analysis scenario.
For example, if several activities in several different business process definitions (BPDs) exceed a range that you establish in the heat map settings, you can click each activity shown in the Hotspots list to go directly to the BPD in which that activity resides. The problem activity is shown in red in the heat map of the BPD.
The available hotspots in the Smart Start view are determined by the visualization mode you choose in the heat map settings. For example, if you choose Wait Time as the visualization mode, the Hotspots list includes the following items:
- Activities: displays activities that meet or exceed the criteria that you establish for the most recently run Analysis Scenario. Click a listed activity to see the BPD in which it resides.
- Teams: displays teams that meet or exceed the criteria that you establish for the most recently run analysis scenario. Click a listed team to open it.
However, if you choose Exception Path, Happy Path, or Path as the visualization mode, the Hotspots list shows paths that meet or exceed the criteria that you establish instead of activities.
The Scenario Scope in the Smart Start view includes:
- Processes: displays a list of each of the processes included in the most recently run analysis scenario. Click a listed process to view the BPD.
- Teams: displays a list of each of the teams included in the most recently run analysis scenario. Click a listed team to open it.
Sample simulations
Before you implement a process, simulations can help you pinpoint potential issues such as bottlenecks caused by resource constraints or a particular path being taken more often than is optimal.
- Run a quick simulation In this sample, you will walk through setting simulation values for the elements in a process and then quickly running a single simulation of the process.
- Taking advantage of simulation profiles and scenarios Creating and comparing multiple simulation profiles and scenarios enables you to demonstrate the best solution to your team.
Run a quick simulation
In this sample, you will walk through setting simulation values for the elements in a process and then quickly running a single simulation of the process. The process you create is used to determine whether to reject or accept a billing dispute. The flow of the process is as follows:
- The process begins with someone in the call center gathering dispute information from a client or as the result of a message received by the billing disputes system.
- The billing disputes system determines if further research is required and also if approval is required.
- If research is required, the offline call center performs the research and passes the dispute on to the call center managers for review (if approval is required).
- If managers review and approve the dispute, the billing system performs the necessary updates to enact the transaction.
- If managers review and determine that more research is required, the dispute goes back to the offline call center for further research.
- If research and review are not required, paths exist to take the dispute directly to the billing system as approved.
- If research is required and review is not required, a path exists from the research activity to route the dispute to the billing system as approved.
- If managers review and reject the dispute, the process ends.
To run a quick simulation:
- Set simulation values by clicking the Approval Required gateway in the diagram and then click Simulation in the Properties tab.
- To facilitate running a quick simulation, leave the selected scenario at Default and then, in the Outgoing Flow Percentage section, type 60 in the Yes (Review for Approval) field. This means that 60% of the disputes that do not require research are going to require approval.
- Select the Review for Approval activity in the diagram. In the Simulation properties, use the Default scenario for this quick simulation and leave that setting and then estimate the execution time. Select Normal in the Distribution Type list and specify that it will take an average of 1 hour and 10 minutes to approve or reject a dispute by typing 1 in the Hours field, 10 in the Minutes field for the Average line.
- To estimate the number of managers for the simulation,
click the Manager swimlane. Click Call Center Managers) to open and edit the simulation
properties for the team.
- You can expect to have at least two managers available to handle this work and so under Simulation properties, select Use Estimated Capacity in the Capacity list and type 2 in the text box.
- To run a simulation using the values provided in the preceding steps, go to the BPD diagram and click the Starts a new simulation for the current process only icon (
 ) in the upper-right corner of the window. When you run a simulation for your current process using the toolbar icon, the default visualization mode is Wait Time. So, the heat
map results highlight tasks that could potentially cause gaps in process execution because a person or system is not available to complete those tasks. The heat map shows the Review for Approval activity has the longest wait time of approximately 9 hours.
) in the upper-right corner of the window. When you run a simulation for your current process using the toolbar icon, the default visualization mode is Wait Time. So, the heat
map results highlight tasks that could potentially cause gaps in process execution because a person or system is not available to complete those tasks. The heat map shows the Review for Approval activity has the longest wait time of approximately 9 hours.
- To improve the wait time, go back to the properties for the Call Center Managers team and change the estimated capacity from 2 to 4 managers.
- Run the simulation again from the toolbar, and notice the results are better.
By doubling the available resources, you reduced the wait time for the Review for Approval activity from 9 hours to 2 hours.
The Optimizer enables you to quickly manipulate simulation settings to ensure that you are able to closely represent the environment in which your process will run. In some cases, it may be necessary to alter the process design to accommodate other constraints. For example, in the preceding sample it is impossible to increase the number of available managers for this process.
So you can add a Timer Event to the Review for Approval activity to remind managers of pending approvals at defined intervals. This would make sense if the pending approvals for billing disputes are higher priority than other tasks for members of this management team.
The advantage of the Optimizer is that you can create and save several simulation profiles to represent different staffing levels and other variables, which enables you to demonstrate predicted performance to your management or other corporate teams invested in the success of the process models. Simulation profiles and simulation scenarios provide flexibility when you need to analyze predicted performance to foster decisions about proposed process designs.
Taking advantage of simulation profiles and scenarios
Creating and comparing multiple simulation profiles and scenarios enables you to demonstrate the best solution to your team. After running some quick simulations in the preceding section, you know that adding resources to your process results in acceptable wait times. But, it is not possible to actually increase resources for the problematic activities. Another possibility is to devise a way to categorize billing disputes so that a smaller percentage of disputes would actually require approval. In order to demonstrate the options and outcomes to the corporate automation team, you can create two separate simulation profiles for this single process:
- One simulation profile called Current Flow to represent the current flow of disputes that require approval.
- An additional simulation profile called Improved Flow to represent improvements gained from categorizing disputes before submission.
Demonstrating the options and flexibility of simulation profiles and scenarios:
- To create the simulation profile called Current Flow, follow these steps:
- Open the Billing Disputes process in Process Designer.
- Select the Approval Required gateway in the diagram.
- Click Simulation in the Properties tab.
- Under Simulation Profile, click New to create a new profile to represent the current flow of disputes that require approval.
- Name the new profile Current Flow and click OK.
- In the Outgoing Flow Percentage area, type 60 in the Yes (Review for Approval) field.
- Select each activity and gateway for which you want to specify simulation values for the current flow profile.
When specifying simulation properties for each process element, be sure the current flow profile is selected.
- To create the simulation profile called improved flow, follow these steps:
- Select the Approval Required gateway in the Billing Disputes process diagram.
- Click Simulation in the Properties tab.
- Under Simulation Profile, click New to create a new profile to represent the improved flow of disputes.
- Name the new profile Improved Flow and click OK.
- In the Outgoing Flow Percentage area, enter 30 for the Yes (Review for Approval) field.
- Select each activity and gateway for which you want to specify simulation values for the improved flow profile.
When specifying values in the simulation properties for each process element, be sure the Improved Flow profile is selected.
- You also need to create two separate simulation scenarios
so that you can run a comparative analysis. To create the first scenario, follow these steps:
- In Process Designer, expand Processes and select Simulation Analysis Scenario from the list of components.
- Type Bill Disputes Current Flow in the Name field and click Finish.
- Click Limit process instances and type 50 in the Max instances field.
- Under Process Apps to Include in Analysis click the Add button and then select the process application that contains the Billing Disputes process.
- Under Processes to Include in Analysis click Add and then select the Billing Disputes from the list.
- Under Simulation Profile, click Default to display a list of simulation profiles that have been created for the billing disputes process and then select the Current Flow profile.
- Leave the Team Overrides section blank.
- Click the Save icon in the main toolbar.
- To create the second scenario, follow these steps:
- Click the plus sign next to Processes and select Simulation Analysis Scenario from the list of components.
- Name the scenario Bill Disputes Improved Flow and click Finish.
- Apply the settings from the previous scenario, except this time, choose the Improved Flow simulation profile.
- Click the Save icon in the main toolbar.
- Now you can run in simulation versus simulation mode to compare wait time, execution time, and so on.
- Open the Optimizer using the drop-down list at the top of Process Designer.
- In the Analysis Scenarios view, choose Simulation vs. Simulation from the Mode list.
- Under Selected Scenarios, for sample A click Select and choose Bill Disputes Improved Flow from the list.
- For baseline B, click Select and choose Bill Disputes Current Flow from the list.
- In the Heatmap Settings view, change the visualization mode setting to Wait Time, using the clock time to show the average value.
- Click Calculate in the Analysis Scenarios view.
The heat map shows that reducing the percentage of disputes that require approval decreases the wait time for the review for approval activity from approximately 9.5 hours to 2.5 hours.
That way, you can demonstrate that reducing the percentage of disputes routed for review to 30% (it is possible to do this by adding a task, and business variables to categorize disputes), improves wait times and process execution in general. The Optimizer enables you to quickly demonstrate the performance issues, plus IBM Business Process Manager enables you to quickly build and then demonstrate proposed design solutions.
Sample historical analyses and comparisons
- Run an historical analysis When you are running instances of your processes and those processes have been configured to track data, you can run historical analyses in BPM Optimizer to determine how well those processes are performing.
- Use the guided optimization wizard IBM Business Process Manager provides guided optimization from the Recommendations view in the BPM Optimizer. The wizard helps you analyze your processes to determine if there are correlations between business data values and potential process outcomes.
- Run a Simulation vs. Historical comparison You can compare analysis scenarios in the Optimizer.
Run an historical analysis
When you are running instances of your processes and those processes have been configured to track data, you can run historical analyses in BPM Optimizer to determine how well those processes are performing. With simulations, you provide values that enable the Optimizer to estimate execution times and potential delays for activities. With historical analyses, you are able to analyze your processes based on the historical data that IBM tracks and stores in the Business Performance Data Warehouse.
The following image shows the diagram of the sample process that will be analyzed:
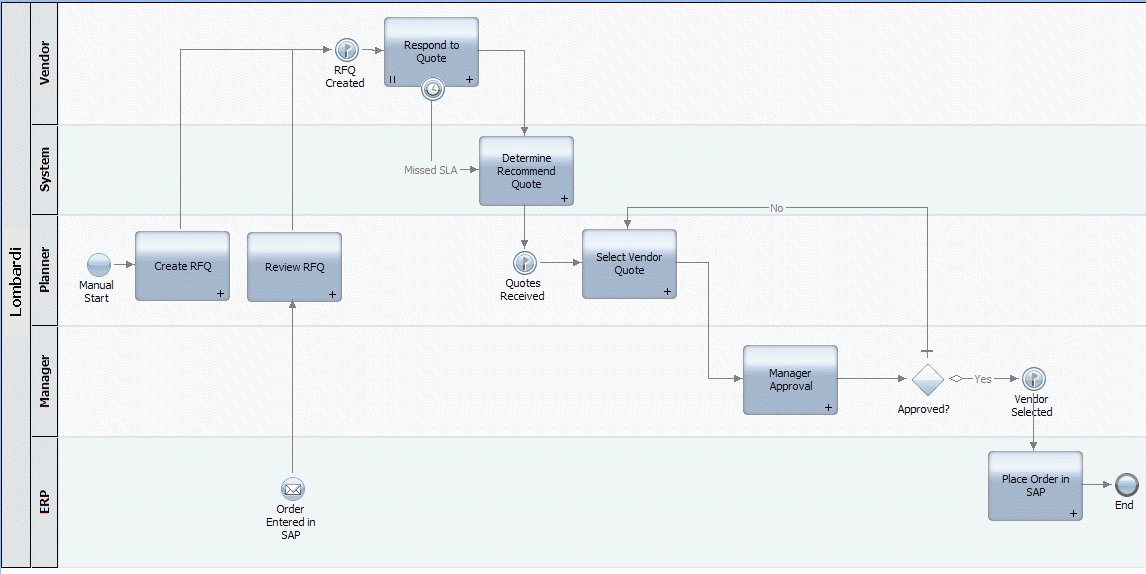
The flow of the sample process is as follows:
- The process begins by a planner creating a request for quote (RFQ).
- A quote solicitation is sent out to a number of vendors.
- Each vendor responds with a proposed quote.
- The proposals are delivered to the planner, who reviews them and selects one for approval.
- The selected proposal is sent for manager approval.
- If approved, the inventory system is updated and the order is placed. If rejected, the planner is asked to choose an alternative proposal. This loop is repeated until a proposal is approved.
In the following example, you'll analyze historical data for this process to determine if any activities are bottlenecked. For this analysis, we need to configure one Historical analysis scenario as outlined in the following steps:
- In Process Designer, click the plus sign next to Processes and select Historical Analysis Scenario from the list of components.
- Name the scenario Vendor Mgmt and click Finish.
- In the Include Process Instances area, click All to analyze data for both completed and currently executing (in flight) process instances.
- In the Time Range list, select All Available. We want to analyze all data stored in the Performance Data Warehouse, instead of data from a particular timeframe such as last month or last quarter.
- Under Process Apps to Include in Analysis, click Add and then select the process application that contains the process.
- Under Processes to Include in Analysis, click Add and then select the process to analyze.
- Click Save in the main toolbar to save the scenario.
- To run the analysis, follow these steps:
- Run the optimizer with the Analysis Scenarios view configured as follows.
- Set the mode to Single Historical.
- Use the VendorMgmt scenario.
- Set the mode to Single Historical.
- In the Heatmap Settings view, set the visualization mode to Wait Time and choose to show the average value.
- Click Calculate in the Analysis Scenarios view.
- Run the optimizer with the Analysis Scenarios view configured as follows.
In the resulting heat map, you can see the wait time for the manager approval activity is over 1 day and 11 hours. This means that, on average, 1 day and 11 hours are elapsing between the time that a manager approval task is received by managers and they are able to open and start the task. Considering that this analysis is based on actual data from this process running in the environment, this wait time is an average that you may want to improve and the Guided Optimization Wizard can help.
After running a historical analysis as shown in the preceding example, you can save the Historical Analysis Scenario as a simulation. When the optimizer finishes running a historical analysis, a Save as Simulation option appears in the Analysis Scenarios view. Click the option and then provide a name for the scenario in the New Simulation Analysis Scenario window. The optimizer opens the simulation analysis scenario so you can make any necessary changes and save it for future use.
Use the guided optimization wizard
IBM Business Process Manager provides guided optimization from the Recommendations view in the BPM Optimizer. The wizard helps you analyze your processes to determine if there are correlations between business data values and potential process outcomes.
The wizard might help you discover that you approve all claims under a particular amount for a particular vendor. In such cases, you can improve your process by automatically approving those claims and bypassing the manual review. The following example demonstrates how to use guided optimization to continue the process analysis that you started in the preceding section.
Guided optimization is available only when you perform historical analyses in BPM Optimizer.
Use the guided optimization for process analysis:
- From the Recommendations view, scroll down to the recommendation named Investigate bypassing 'Manager Approval' and click Launch Bypass Wizard.
- In the Variable Analysis - Settings window, select the Variable to Predict from the list. Choose a variable the activity changes. For example, as in the following image, select the status variable because the Manager Approval activity sets the value of this variable to either approve
or reject. Choose a variable for which a certain set of business data can always create the same result. If so, bypass the work done in the activity and automatically set the predicted value.
- From the Variables to Consider section of the Variable Analysis - Settings window, clear selections for any variables that you do not want to be considered in the predictive analysis. Pick all the variables that you think can significantly affect the outcome of the activity. For example, in the following image, all variables are selected since each could impact the outcome for this activity.
- For this example, accept the default selections for the Confidence and Complexity sections. The Confidence setting tells the Optimizer to only suggest bypasses that are correct the shown percentage of time. The Complexity setting determines how complex the suggested bypass designs might be.
- Click Next. The Optimizer runs its calculations to find the correlations between the selected variables and the historical data. The analysis results for this example show the analyzed activity resulted in an approved quote 100% of the time when the vendor was BJR Supplies and the price was less than $11, 307.00.
- Click Continue and Bypass Activity, and then click Next. In the Bypass Activity Rules window, the wizard displays the rules that it recommends.
- Select the check box next to the rule to automatically accept quotes that are from BJR Supplies and are less than 11, 307. The Manager approval is required for quotes from BJR Supplies only when the price matches or exceeds the specified price value.
- In the Bypass Activity Rules window, click either Create with Rule Service or Create with Script Activities for your process. Create with Rule Service causes fewer visible changes to your process but shows where a rule is used in a process directly on the diagram. A rule service is also a reusable library item, unlike an embedded script. As in this example, click Create with Rule Service.
- In the Bypass Activity Rules window, click Pre-Configure What-If Analysis.
The wizard automatically creates a new simulation scenario that incorporates the previously selected rules and then performs a what-if analysis by comparing the simulation of the rules to the historical data for the process.
When selected, the Pre-configure What-If Analysis check box, makes the appropriate selections in the Analysis Scenarios view, but the analysis does not run until you click Calculate in the Analysis Scenarios view.
For simulation scenarios created by the Guided Optimization Wizard, the results are more meaningful if the process being analyzed is run often and is initiated on a regular schedule (flat distribution).
- Click Finish.
The Optimizer creates the required components for the bypass rule service and adds them into your process diagram, complete with sequence lines and appropriate component properties.
To review the changes introduced by the bypass wizard:
- From the Designer, double-click the Manager Approval bypass rule service activity to view the attached rule service.
- Double-click the Bypass Manager Approval Rule Service to view its structure.
- Select a rule condition from the table and then click the Action section to view the auto-generated action that each rule that is true runs at run time.
Run a Simulation vs. Historical comparison
You can compare analysis scenarios in the Optimizer.
To run the Simulation vs. Historical (What if) analysis that was automatically generated by the wizard in the preceding sample, follow these steps:
- Go to the Analysis Scenarios view in the Optimizer to see the settings established by the wizard. Notice the simulation data for the revised process (with the built-in service to bypass the approval step) will be compared to the Historical Analysis Scenario that originally revealed the wait time issue.
- Click Calculate in the Analysis Scenarios view.
The heatmap now shows the Approval Activity is no longer bottlenecked.
You can run similar what-if comparisons by doing one of the following actions:
- Creating different versions of your process with additional services or other workarounds.
- Creating a simulation profile for each version of the process.
- Creating a Simulation Analysis Scenario in which you can pick and choose from the profiles created in the preceding step.
- Run a Simulation vs. Historical (What if) comparison using a default Historical Analysis Scenario (like All Available) for the baseline and the Simulation Analysis Scenario from the preceding step as the sample.