Performance report
Content
- Overview
- Overall page
- Summary page
- Page Performance page
- 10 slowest page elements
- Response vs. Time Summary page
- Response vs. Time Detail page
- Page Throughput page
- Server Throughput page
- Server Health Summary page
- Server Health Detail page
- Resources page
- Page Element Responses
- Related
Overview
The Performance report...
- summarizes the validity of the run
- summarizes the data most significant to the run
- shows the response trend of the slowest 10 pages in the test
- graphs the response trend of each page for a specified interval.
Overall page
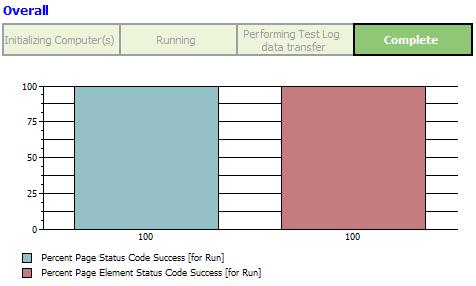
Provides a progress indicator showing the state of the run, and a bar chart showing overall success of the run...
- For the entire run, the percentage of status codes that indicated page element success.
Page element success means that the response code verification point passed for that request. If a request has no verification points, success means that the server received the request and returned a response with a status code in the 200 or 300 category, or returned an expected response with a status code in the 400 or 500 category.
- For the entire run, the percentage of status codes that indicated page status code success.
Page status code success means that the response code verification point passed for the primary request. If a primary request has no verification points, success means that the server received the primary and returned a response with a status code in the 200 or 300 category, or returned an expected response with a status code in the 400 or 500 category.
- The percentage of page title verification points that passed, if any were set.
- The percentage of response code or response size verification points that passed, if any were set.
Summary page
The Summary page summarizes the most important data about the test run, so that you can analyze the final or intermediate results of a test at a glance.The Summary page displays the following Run Summary information:
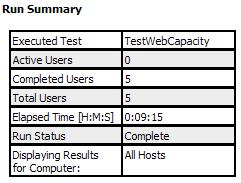
- Active Users
This number is updated during the run.
- Elapsed Time
Run duration. Displayed in hours, minutes, and seconds.
- Run Status, which can be...
- Initializing Computers
- Add Users
- Running
- Transferring data to test log
- Stopped
- Complete
- Displaying results for computer: All Hosts.
To see summary results for individual computers, click the computer name in the Performance Test Runs view.
The Summary page displays the following Page Summary information:
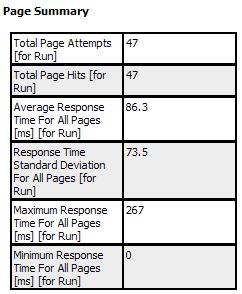
- Average Response Time For All Pages
Response time is the sum of response times for all page elements (including the connect time and inter-request delays). Response time counters omit page response times for pages containing requests with status codes in the range of 4XX (client errors) to 5XX (server errors). The only exception is when the failure (for example, a 404) is recorded and returned, and the request is not the primary request for the page. Page response times which contain requests that time out are always discarded.
- Maximum Response Time For All Pages
- Minimum Response Time For All Pages
- Total Page Attempts and Total Page Hits
A page attempt means that a primary request was sent; it does not include requests within the page.
A hit means that the server received the primary request and returned any complete response.
- A summary of the results for page verification points, if these verification points were set.
The Summary page displays the following Page Element Summary information:
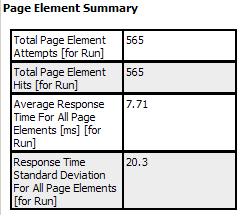
| Average Response Time For All Page Elements | Time between the first request character sent and the last response character received. Response times for HTTP requests that time out or that return an unexpected status code (the recorded and played back codes do not match) in the range of 4XX (client errors) to 5XX (server errors) are discarded from the reported values. |
| Response Time Standard Deviation For All Page Elements | |
| Total Page Element Attempts and Total Page Element Hits | A page element attempt means that a request was sent. A hit means that the server received the request and returned any complete response. |
| Percentage Of Verification Points That Passed | |
| Summary of results for page element verification points | If these verification points were set. |
If you have set transactions in test, the Summary page displays the following Transaction information:
- The minimum, maximum, and average response time for all transactions.
Response time is the actual time spent within the transaction container.
- The standard deviation of the average response time.
- The total number of transactions that were started and the total number that have been completed.
Page Performance page
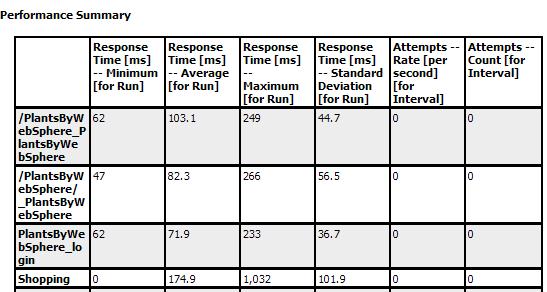
The Page Performance page shows the average response of the slowest 10 pages in the test as the test progresses. With this information, you can evaluate system response during and after the test.
The bar chart shows the average response time of the 10 slowest pages. Each bar represents a page that you visited during recording.

As you run the test, the bar chart changes, because the 10 slowest pages are updated dynamically during the run.
For example, the Logon page might be one of the 10 slowest pages at the start of the run, but then, as the test progresses, the Shopping Cart page might replace it as one of the 10 slowest. After the run, the page shows the 10 slowest pages for the entire run.
The table under the bar chart provides the following additional information:
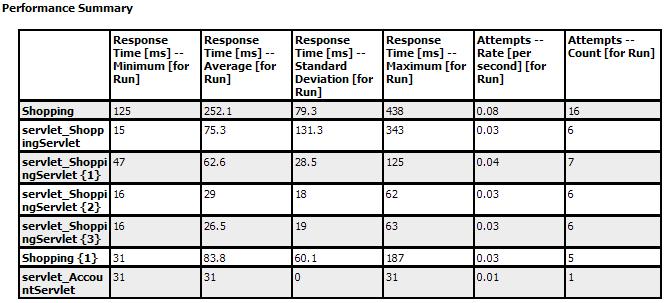
| Response Time Minimum | Time between the first request character sent and the last response character received.
Response time counters omit page response times for pages containing requests with status codes in the range of 4XX (client errors) to 5XX (server errors). The only exception is when the failure (for example, a 404) is recorded and returned, and the request is not the primary request for the page. Page response times which contain requests that time out are always discarded. |
| Response Time Average | This matches the information in the bar chart. |
| Response Time Standard Deviation | |
| Response Time Maximum | |
| Attempts Rate | An attempt means that a primary request was sent; it does not include requests within the page. |
| Attempts Count |
10 slowest page elements
To display the 10 slowest page element response times, right-click on the Page Performance page and select...
-
Display Page Element Responses
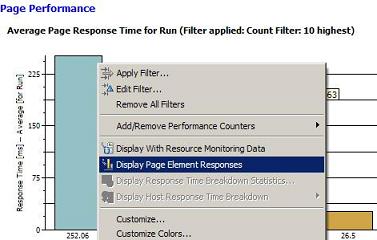
For example...

Response vs. Time Summary page
The Response vs. Time Summary page shows the average response trend as graphed for a specified interval. It contains two line graphs with corresponding summary tables. When a schedule includes staged loads, colored time-range markers at the top of the graph delineate the stages.
Page Response vs. Time
Shows the average response time for all pages during the run.
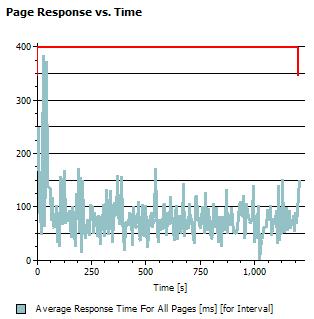
Each point on the graph is an average of what has occurred during that interval.
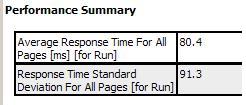
The table after the graph lists one number the total average response time for all pages in the run.
Page Element Response vs. Time
Shows the average response time for all page elements during the run.

Each point on the graph is an average of what has occurred during that interval.
The table under the graph lists one number the total average response time for all page elements in the run.

You set the Statistics sample interval value in the schedule, as a schedule property.

Response vs. Time Detail page
The Response vs. Time Detail page shows the response trend as graphed for the sample intervals. Each page is represented by a separate line.
The Average Page Response Time graph shows the average response of each page for each sample interval.

When a schedule includes staged loads, colored time-range markers at the top of the graph delineate the stages.
The table after the graph provides the following additional information:
| Response Time - Minimum | The minimum page response time for the run.
Response time is the time between the first request character sent of the primary request and the last response character received. Response time counters omit page response times for pages containing requests with status codes in the range of 4XX (client errors) to 5XX (server errors). The only exception is when the failure (for example, a 404) is recorded and returned, and the request is not the primary request for the page. Page response times which contain requests that time out are always discarded. |
| Reponse Time - Average | The average page response time for the run.
This is similar to the graph, but the information in the table includes the entire run. |
| Response Time Standard Deviation | The standard deviation of the average response time. |
| Response Time Maximum | Maximum page response time for the run. |
| Attempts Rate | Rate of page attempts per interval for the most recent statistics sample interval.
A page attempt means that the primary request was sent; it does not include requests within the page. You set the Statistics sample interval value in the schedule, as a schedule property.
|
| Attempts Count | Number of page attempts per interval. |
Page Throughput page
The Page Throughput page provides an overview of the frequency of requests being transferred per sample interval.
- The Page Hit Rate graph shows...
- Page attempt rate per second
- Page hit rate per second
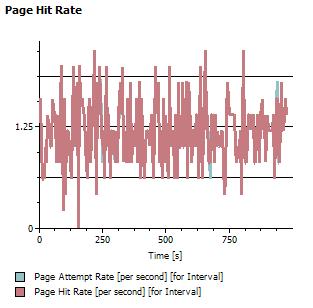
A page attempt means that the primary request was sent; it does not include requests within the page.
A hit means that the server received the primary and returned any complete response. When a schedule includes staged loads, colored time-range markers at the top of the graph delineate the stages.
The summary table after the graph lists the total hit rates and counts for each page in the run.
- The User Load graph shows active users and users that have completed testing, over the course of a run.
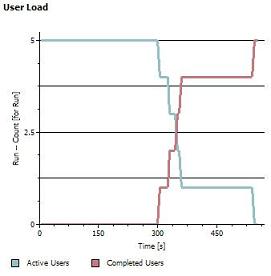
As the run nears completion, the number of active users decreases and the number of completed users increases. The summary table after the graph lists the active and completed users for the entire run.
To set the sample interval value, open the schedule, click the Statistics tab, and then view or modify Statistics sample interval.
If the number of requests and hits are not close, the server may be having trouble keeping up with the workload.
If you add virtual users during a run and watch these two graphs in tandem, you can monitor the ability of system to keep up with the workload. As the page hit rate stabilizes, even though the active user count continues to climb and the system is well tuned, the average page response time will naturally slow down. This is because the system is running at its maximum effective throughput and is effectively throttling the rate of page hits by slowing down how quickly it responds to requests.
Server Throughput page
The Server Throughput page lists...
- Rate and number of bytes transferred per interval and for the entire run
- Status of the virtual users for each interval and for the entire run.
The Byte Transfer Rates graph shows the rate of bytes sent and received per interval for all intervals in the run.
![]()
Colored time-range markers at the top of the graph delineate the stages.
The summary table after the graph lists...
- The total number of bytes sent and received for the entire run
- Overall rate of bytes sent and received for the entire run
The User Load graph shows active users and users that have completed testing, per sample interval, over the course of a run.

You set the Statistics sample interval value in the schedule, as a schedule property.
As the run nears completion, the number of active users decreases and the number of completed users increases. The summary table after the graph lists the active and completed users for the entire run.
Bytes sent and bytes received throughput rate, which is computed from the client perspective, is typically analyzed with other metrics, such as the Page Throughput and resource monitoring data, to understand how network throughput demand affects server's performance.
Server Health Summary page
The Server Health Summary page gives an overall indication of how well the server is responding to the load.
- The Page Health chart shows...
- Total number of page attempts
- Page hits
- Status code successes

The table under the bar chart lists the same information.
A page attempt means that a primary request was sent; it does not include requests within the page.
A hit means that the server received the primary and returned any complete response.
A success means that the response code verification point passed for that request. If the request has no verification points, a success means that the server received a request and returned a response where the status code was in the 200 or 300 category, or returned an expected response in the 400 or 500 category.
- The Page Element Health chart shows...
- Total number of page element attempts
- Page element hits
- Status code successes

The table under the bar chart lists the same information.
Server Health Detail page
The Server Health Detail page provides specific details for the 10 pages with the lowest success rate.
- The bar chart shows the 10 pages with the lowest success rate.

- The summary table under the chart lists, for all pages, the number of attempts, hits, and successes in the run, as well as the attempts per second during the run.
An attempt means that a primary request was sent; it does not include requests within the page.
A hit means that the server received the primary and returned any complete response.
A success means that the response code verification point passed for that request. If the request has no verification point, a success means that the server received a request and returned a response where the status code was in the 200 or 300 category, or returned an expected response in the 400 or 500 category.
Resources page
The Resources page shows all resource counters monitored during the schedule run.
- The Resources graph shows the values of the resources counters monitored during the schedule run. When a schedule includes staged loads, colored time-range markers at the top of the graph delineate the stages.
The chart scales automatically to accommodate the highest resource counter value.
- The summary table under the chart lists the most recent values of the resource counters monitored during the schedule run. This table also lists the minimum, maximum, and average values of the resource counters monitored during the schedule run. This table is organized by resource monitoring hosts.
Page Element Responses
The Page Element drill down page shows the 10 slowest page element responses for the selected page.
Related
- Why response time of a page does not equal the sum of its requests
- Page Element report
- Percentile report
- Verification Points report