Perfmon Launch Configuration
Creating a Perfmon Launch Configuration
To launch a new Perfmon Agent using the Profiling Launch Configurations:
- Make sure you have a Project in your workspace to hold the trace data
- Switch to the profiling perspective using Window > Open Perspective > Other > Profiling and Logging
- Open the Launch Configurations dialog using Run > Profile
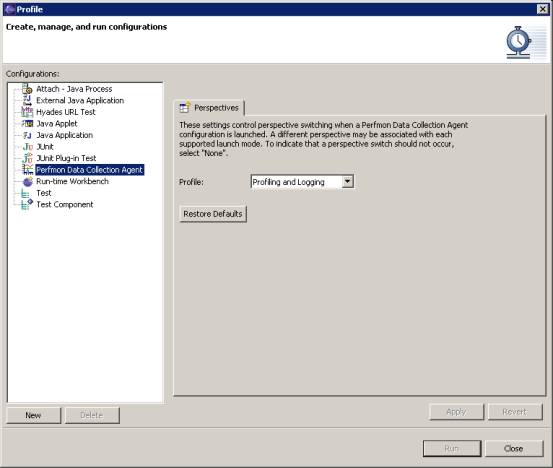
- Right-click on Perfmon Data Collection Agent and select New
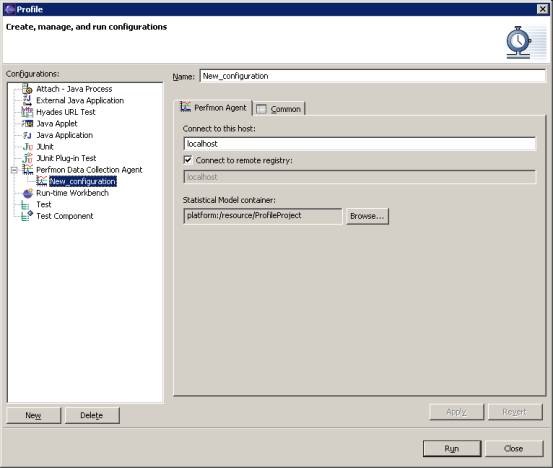
- Enter a name for the configuration in the Name: field
- Select the Project you wish to store the trace data in using the Browse button next to the Statistical Model container field
- Select the host to be used and click Apply, then Run
- The Agent Controller must be running on the machine specified in Connect to this host.
- If the performance objects are required for the machine on which Hyades is actually running (i.e. localhost), you do not need to change any information in the dialog box.
- If the performance objects from a remote machine are required, select Connect to remote registry and type the name or IP address of the remote machine. Note : use the Perfmon format for specifying the remote machine, i.e. preceed the host name or IP address with double backslashes, e.g. "\\192.168.1.23" or "\\smithy".
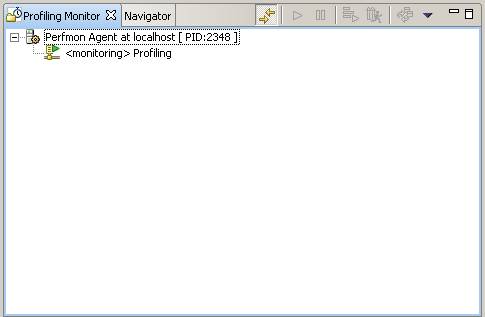
- The Profiling Monitor view will open and after a short while you will see the agent appear
- To configure the Perfmon counters you wish to trace, right click on the agent node select Configure Perfmon Counters. A counter configuration dialog will appear.
Note : in the case of a performance trace node, only the highest level performance objects are initially displayed. These highest level performance object are typically not actually metrics, but rather containers for related metrics. To expose the actual metrics recursively request the children of a particular performance object until its metrics are displayed. To request the children of a performance object, select Get Child Counters from its pop-up menu and then wait for the "+" symbol to appear beside the performance object in the tree to indicate that its children have been retrieved.
Observing data in the Statistical Data view
- Open the Statistical Data view using Window > Show View > Other > Profiling and Logging > Statistical Data
- Link the Profiling Monitor view to the Statistical Data view by selecting the Link with Viewer button on the Profiling Monitor view
![]()
- Select the agent in the Profiling Monitor view
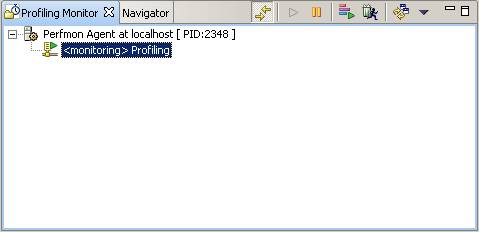
- The trace will appear in the Statistical Data view
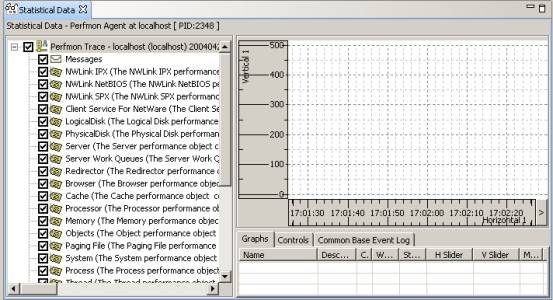
- To configure the counters, right-click on the agent node or any counter node and select Configure Perfmon Counters
Related concepts
Statistical Console
Related tasks
Creating a performance trace
Configuring performance objects
Starting and stopping a trace
Viewing statistical models
Perfmon Launch Configuration
Creating a new statcon file for performance trace
Related reference
Statistical Console graphs and tables