Viewing a statistical model
To view a statistical model, follow
these steps:
- In the left-hand pane of
the Statistical Console, right click to bring up the popup menu.
- Select Add a new
Trace/Statistical Model. The Resource Selection dialog opens.
- Select the location of the
statistical model file. Click OK. The model is loaded in the
Statistical Console.
Note: The following file types are supported:
- trcaxmi - (Trace
Agent)
- trcpxmi - (Trace
Process Proxy)
- trcnxmi - (Trace
Node)
- trcmxmi - (Trace Monitor)
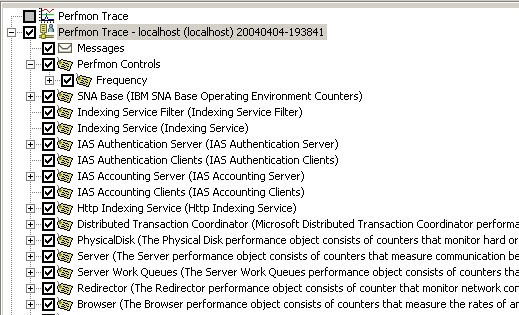
- Select any of the sub-nodes
to be displayed in the graph area.

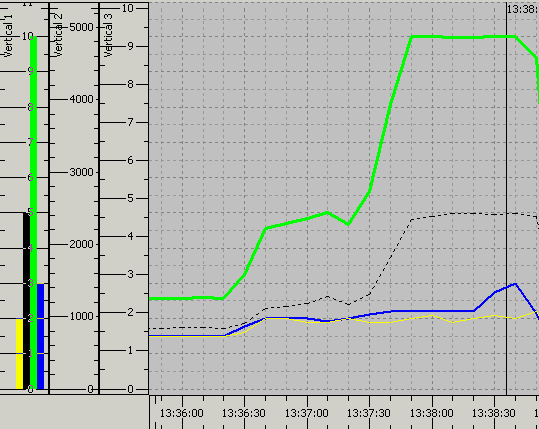
- In the graph, to show all
available data, right click on each of the sliders to get a menu.
- Select Snap to
Associated Graphs. The vertical sliders will be set to the maximum and
minimum values contained within the shown Observations and the horizontal
slider will be set to the maximum and minimum timestamps found within Observations.

Prerequisite(s)
Creating
a new statcon file for performance trace
Creating a performance trace
Configuring performance objects
Related concepts
Monitoring
Performance Counters
Related tasks
Starting and stopping a trace
Related reference
Statistical Console graphs and tables
(C) Copyright Scapa Technologies
Limited. 2003-2004. All Rights Reserved.


