Schedule properties
When you open a schedule, you can set its properties.
User Load page
Right-click in the table, and select Add to add a stage. To modify a stage, select the row, and then click Edit or click the user icon in the first column.
| Users | Enter the total number of users to be active in the stage (not the number of users to add or subtract to those currently running). |
| Run for specified period of time | Enter the length of time (and the time units) for the stage to run. When the specified number of users is achieved, the users will run for up to this time. When the time expires, the users continue to run if they are required for the next stage; otherwise, they are stopped gracefully. |
Click Show Advanced to set further options to prepare the system under test before the users actually enter the stage:
| Set Rate | Enter a number to set a delay between adding or removing each user, rather than adding them or subtracting them all at once. Staggering users avoids overloading the system, which can cause connection timeouts. The User Load Preview shows this delay in black. |
| Settle Time | A system under test might react to a sudden change in user population. With a defined settle time, which starts when the target number of users is reached, the system under test can settle into a steady state so that it can accurately reflect the user population. The User Load Preview shows this time in black. |
| Time limit for a user to respond to a stop request | Optionally enter a value. When a virtual user is asked to stop, it completes its current action (such as an HTTP request) and then finishes. If a virtual user has not finished within the specified time limit, the user is forced to finish. |
| User Load Preview | Previews the user population stages over time. The red line segments indicate that the total number of users has been achieved for the state. |
Think Time page
| Use the recorded think time | Select to play back a test at the same rate that it was recorded. This option has no effect on the think time. |
| Specify a fixed think time | Each user's think time is exactly the same value: the value that we specify. Although this does not emulate users accurately, it is useful if to play a test back quickly. |
| Increase/decrease the think time by a percentage | Type a percentage in Think time scale. Each user's think time is multiplied by that percentage. A value of 100 causes no change in think times. A value of 200 doubles the think times, so the schedule plays back half as fast as it was recorded. A value of 50 reduces the think times by half, so the schedule plays back twice as fast. A value of 0 indicates no delays. |
| Vary the think time by a random percentage | Each user's think time is randomly generated within the upper and lower bounds of the percentages that you supply. The percentage is based on the recorded think time. For example, if you enter 10 in Lower limit and enter 90 in Upper limit, the think times will be between 10 percent and 90 percent of the original recorded think time. The random time is uniformly distributed within this range. |
| Maximum think time | Set a maximum think time is useful with tests that emulate actual think times. By setting a maximum, you do not have to search for and edit each long think time within a test. Numerous factors can generate long think times, for example, you might be interrupted while recording. To restore the original think times, clear this check box. |
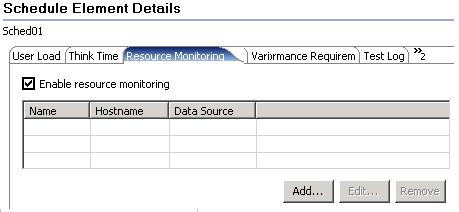
Resource Monitoring page
| Enable resource monitoring | Select to activate resource monitoring.
The available data sources are captured from these sources:
Resource monitoring data can provide a more complete view of a system to aid in problem determination. |
| Ignore invalid resources when executing the schedule | Select this setting to suppress any error messages that invalid resources cause, such as unreachable hosts or invalid host names. If you select this option, you must view logs to see error messages. |
Statistics page
| Statistics log level | These options are listed in order of the increasing amount of data that they collect for the test log.
| ||||||||||
| Statistics sample interval | Sets the sampling interval for reports. When you run a schedule, the reports show such information as response time during a specific interval, the frequency of requests being transferred during an interval, and the average response trend during an interval. You set this sampling interval here. | ||||||||||
| Only store All Hosts statistics | Select this option unless you are running a performance test over different WANs, and you are interested in seeing the data from each remote computer. |
Variable Initialization
Use this page to initialize variables at the schedule level. When you initialize variables at the schedule level, all the user groups in the schedule use the variable initial values, except those for which a specific value is defined.
| Add | Add a variable and initialize a value. The Used by column displays the test name that uses the corresponding variable. A warning icon is displayed for a variable that overrides the value specified at the schedule level or user group level and uses the value defined at the test level with the visibility set to This test only. Hover the cursor over the warning icon to view the tests that override the variable initial values. |
| Export | Export the variables defined at the schedule level to a file. |
| Use variable initial values file | Select this check box to use the variable values from a file. Click Browse to select an existing file or click New to create a file. |
Performance Requirements page
| Enable Performance Requirements | Select to enable the use of performance requirements for this schedule. |
| Name | Name of this set of performance requirements. This name is used in the Performance Requirements report. By default, the name is Performance Schedule -schedule_name. |
| Use Defaults | Click to reset Name to the default value. |
| Performance Requirement | All performance requirements are displayed in the table. Shaded requirements are not defined for this schedule. To define a requirement, set an Operator and Value. |
| Operator | Click this field to display a list of mathematical operators. Select an operator for this performance requirement. |
| Value | Click this field to set a value for the requirement. |
| Standard | Select to mark the requirement as standard. If a standard requirement is not met, the schedule run will have a verdict of fail, and this verdict will roll up to the entire run, like a verification point failure. Clear to make the requirement supplemental. In general, supplemental requirements are those that are tracked internally. A supplemental requirement cannot cause a run to fail, and its results are restricted to one page of the Performance Requirements report. |
| Hide Undefined Requirements | Select to see only the requirements that you have defined. This hides the shaded rows. |
| Clear | Select one or more requirements and click to remove the definition. The requirement is still available and can be redefined. |
Test Log page
The default setting, to log all errors and warnings and primary test actions, fits most purposes. However, you can log any type of information, from no information to all information from all users, although neither is typical.
- To see only errors and warnings, set the first twoWhat to Log check boxes to All; then clear the third check box, And also show all other types, to avoid logging successful events.
- To check the structure of a schedule, when you are not interested
in the test execution results, set all three What to Log check boxes to Schedule Actions.
Both choices and the default setting limit the size of the test log and reduce the total time to run the schedule by significantly reducing the test log transfer time at the end of a test.
If you are debugging a test, you might set all three What to Log fields to All or Action Details. These settings produce large test logs, especially if the tests are long or you are running a large number of users. Large test logs, in turn, increase the test log transfer time, and might even cause the computer to run out of disk space.
To reduce transfer times and the likelihood of running out of disk space, sample information from a very small subset of users; smaller even than the default of 5 users per user group. A fixed sampling rate samples the same number of virtual users from each group. A percentage sampling rate samples a percentage of virtual users from each group, but guarantees that at least one user is sampled from a group.
Response Time Breakdown page
| Enable collection of response time data | Select to activate response time breakdown collection. This data shows you the response time breakdown for each page element. |
| Detail level | Select Low or Medium to limit the amount of collected data. |
| Only sample information from a subset of users | If you set the detail level to High or Medium, set a sampling rate to prevent the log from getting too large. |
| Fixed number of users | The number that you select is sampled from each user group. Unless you have specific reasons to collect data from multiple users, select Fixed number of users, and specify one user per user group. |
| Percentage of users | The percentage that you select is sampled from each user group, but at least one user is sampled from each user group. |
Problem Determination page
| Problem determination log level | In general, change the problem determination level only when asked to by IBM Software Support. However, under certain conditions, you might want to change the problem determination level. For example, if problems occur when a run reaches a certain number of users, you might increase the level to Config, which is the most detailed level to use without consulting IBM Software Support. |
| Only sample information from a subset of users | Set a sampling rate. |
| Fixed number of users | Number of users to sample from each user group. |
| Percentage of users | Sampled from each user group, but at least one user is sampled from each group. |
Error 404 - Not Found
The document you are looking for may have been removed or re-named. Please contact the web site owner for further assistance.