Create performance test example
- Create a new project
- Create a new test to record the test scenario
- Record the test scenario
- Create a data pool to replace the user ID and password value in the test
- Reference PortalTest to use the data pool value
- Associate the user ID and password values with the data pool column
- Create performance schedules
- Add PortalTest to PortalSched
- Configure response time breakdown for data collection
- Run the Portal test and review the reports
- Resources
Create a new project
- Start web app
- Start RPT, and click OK in the default workspace location to store the test projects
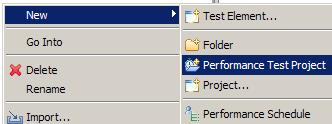
- In the Test Navigator, right-click to display the menu.
- Select...
-
New | Performance Test Project
- Enter the Project Name as PortalProject, and check Use default location.
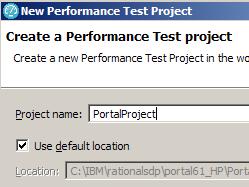
- Click Finish to create the project.
Create a new test to record the test scenario
- After the project is created, the Create New Test from Recording window
will open.
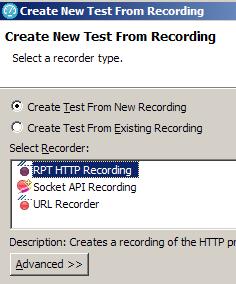
- Check Create Test from New Recording and select HTTP Recording. Click Next.
- For location of test suite, select the PortalProject. In the Test file name field, enter PortalTest.
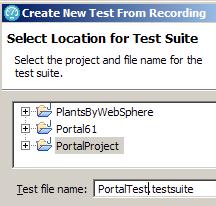
- Click Finish to start initializing the recorder.
- The RPT recorder will open a new browser after it is initialized.
- In the browser, pull up portal
- Log on to the portal and click around..
- Click Logoff and then close the browser.
- The control will return to RPT to process the recording
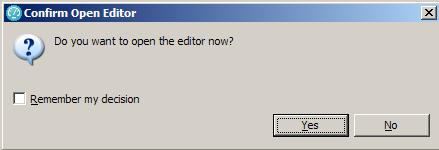
- When the KBytes record panel stops incrementing...
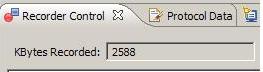
...you will be asked to open the Test Editor
Create a data pool to replace the user ID and password value in the test
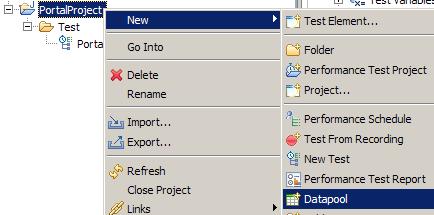
- Right-click project name in Test Navigator and select...
-
New | Datapool
- In parent folder field, enter PortalProject.
In the Name field, enter PortalDatapool.
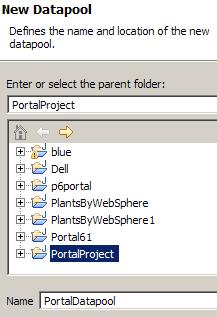
- Click Next.
- For Description, enter...
-
Datapool for the login credentials
For Initial Table Dimension | Number of Variables, enter 2 column.
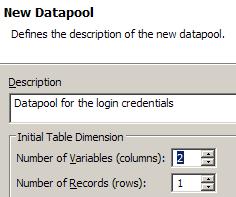
- Click Finish.
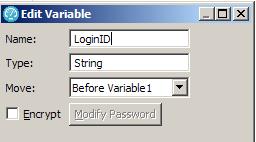
- Next, click the Variable1 column, and the Edit Variable window will open.
- Name the column LoginID and, for Type, enter String. Then click OK.
The data pool will contain five different user login IDs, numbered uid0 through uid4
User ID Password uid0 xxxxx uid1 xxxxx uid2 xxxxx uid3 xxxxx uid4 xxxxx 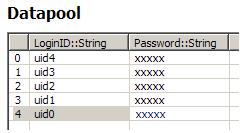
To add a line for the next record, press Enter or right-click on the last record and select Add Record.
Use CRTL-S to save the data pool.
- For each of the above IDs, create an account in Portal using same credentials.
Reference PortalTest to use the data pool value
- In the Test Navigator, click PortalTest to open the property page.
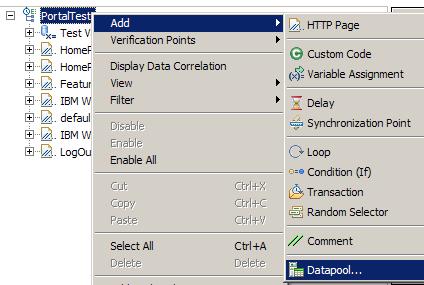
- Right-click PortalTest and select...
-
Add | Datapool
- When the Import Datapool window opens, select the following:
Matching resources: PortalDatapool.datapool. Open mode Shared (per machine) Wrap when the last row is reached checked 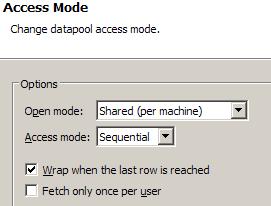
- Click Select to accept the PortalDatapool.data pool for the PortalTest. The Test Element Details will be updated with the data pool information.
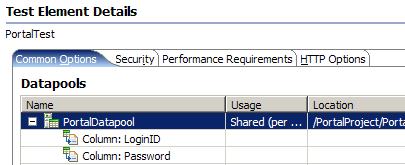
-
To save the changes, use CTRL+S.
Associate the user ID and password values with the data pool column
- In the Test Navigator, click PortalTest to open the property page.
- Select test page with login credentials...
- Click the uid value...

- ...and then select...
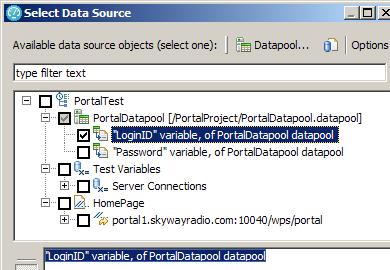
Substitute | Select Data Source
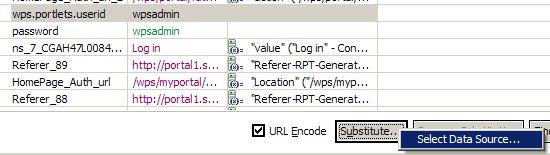
- Select "LoginID".
- Do the same for the password, selecting the "Password" variable.
- The userid and password value will be highlighted in green to indicate the association
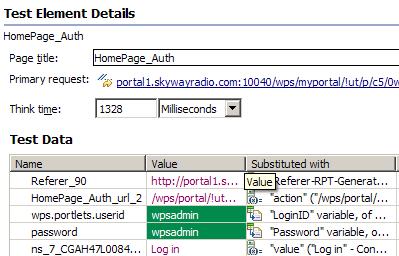
- Save changes.
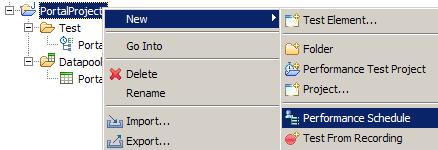
- In the Test Navigator, right-click PortalProject to display
the menu, and then select...
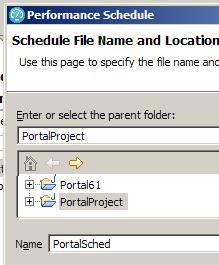
- New > Performance Schedule
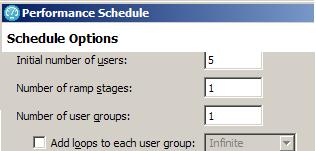
- In the Performance Schedule window, enter PortalSched as the name for the schedule.
The Schedule Options property window shows one user group.
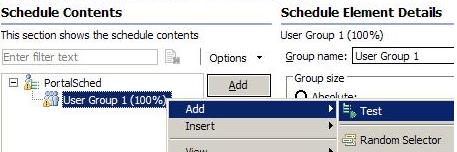
- In the Performance Schedule property window, right-click on User Group 1, and select...
-
Add > Test
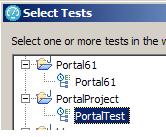
- In the Select Performance Tests window, expand the PortalSched and select PortalTest.
- The test is added to the schedule under User Group 1.
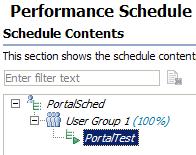
- Save changes.
Configure response time breakdown for data collection
Response time breakdown is configured in a the schedule, and is used to collect statistics on a captured page element when the test runs. Response time breakdown shows how much time was spent on each page that was captured in the test.
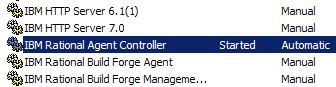
- Verify Agent Controller service is running
- Instrument portal server
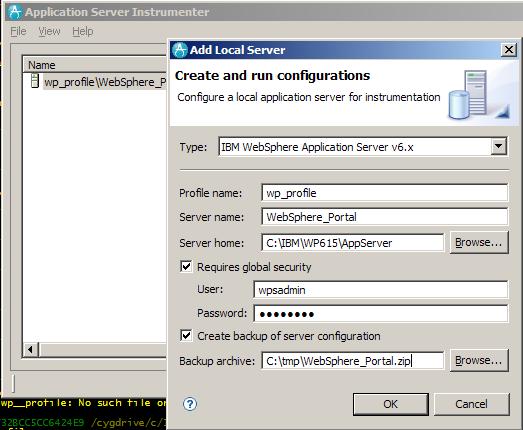
- This will take a few minutes to complete...

- In Schedule Element Details, click >>, go to Response Time Breakdown tab, and select...
- Enable collection of response time data
- PortalTest

- Scroll down, and in Options section, select High as the detail level

- Select...
-
Only sample information from a subset of users | Fixed number of users
...and enter 2 for per User Group.
- Save the changes (CTRL+S).
- Open the test and set reasonable think times for each page...

- Save the changes (CTRL+S).
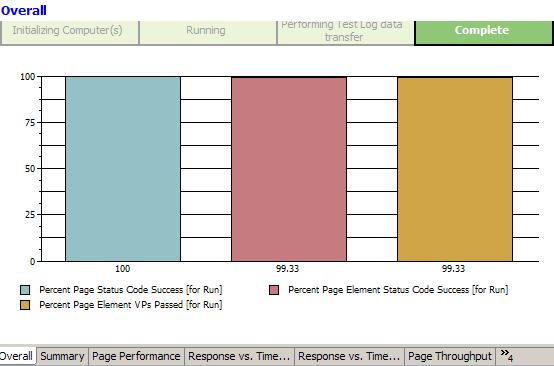
Run the Portal test and review the reports
- Start DCI monitoring

- Click PortalSchedule and click the Run button

RPT will launch the schedule, collect the data, and display the results in reports when the collection is finished.
- Scroll through the different tabs to view the reports.
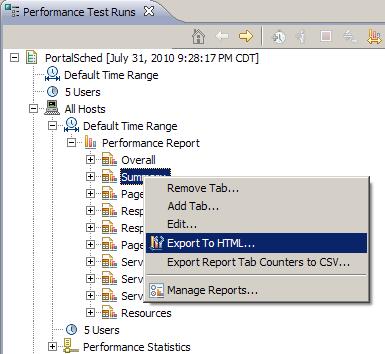
- In the Performance Test Runs view, right-click a report and select...
-
Export
To HTML
For other reports, right-click PortalSchedule and select Display Report from the menu
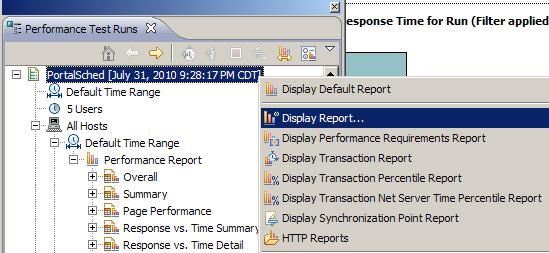
- Enter location of report...
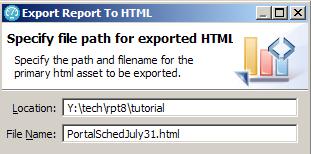
- Here is example output...
- IBM RPT InfoCenter
- RT523: Essentials of IBM RPT V7.0
- Performance Tester area on developerWorks Rational
- developerWorks Rational zone newsletter
- Technology bookstore
- IBM Rational Software Development Platform V7.0 - Desktop Product Activation
- IBM Partner World Software Access Catalog
- developerWorks blogs
- developerWorks community
Next - Run remote test with increased user loads