Enable resource monitoring
Overview
You can enable resource monitoring to capture system resource data such as processor or memory usage.
You need to instrument servers to enable resource monitoring.
To capture accurate resource monitoring data, verify clocks on all computers are synchronized.
If you do not synchronize the clocks on the workbench and on all of the computers involved in a test, resource counters will be displayed inaccurately (with respect to time) in the reports. There are a number of tools that are available at no cost on the Web to help accomplish synchronization.
Valid resource monitoring data sources include...
- IBM Tivoli monitoring agents
- IBM DB2 snapshot monitors
- IBM WebSphere Performance Monitoring Infrastructure
- JBoss Application Server Managed Beans
- Oracle WebLogic Server Managed Beans
- SAP NetWeaver Managed Beans
- UNIX rstatd monitor
- Windows Performance Monitor
Enable resource monitoring
- Open a schedule in the editor.
- In the Schedule Element Details area, click the Resource Monitoring tab and click...
-
Enable resource monitoring

- If this is a new schedule, the Data Source table is empty.
If you have previously added resource monitoring data sources to this schedule, you can edit or remove them. Clicking Remove does not delete the data source from the file system.
- Click Add to add existing locations.
- Location tab
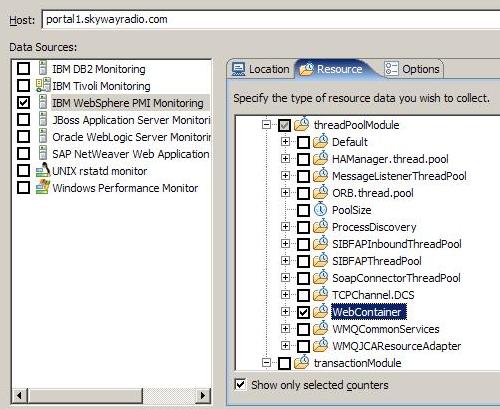
- Resource tab

- Options tab
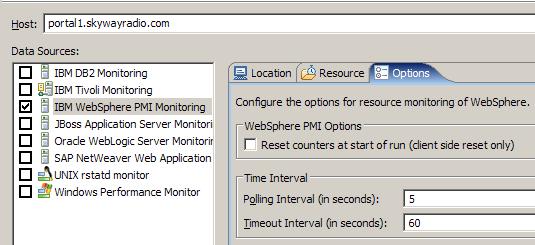
- Save your work...
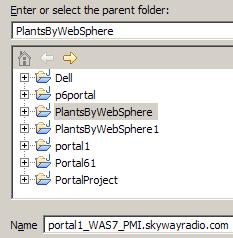
- After saving, your resource monitoring location should appear in the Schedule Element Details area...

- To suppress error messages about unreachable or invalid data sources, select...
-
Ignore invalid resources when executing the schedule

- After starting schedule, you may be challenged for authentication...
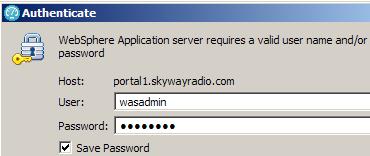
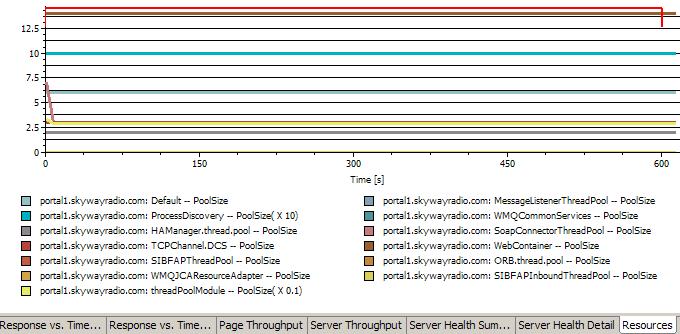
- Results can be found on the Resources tab of the Performance report...
Related tasks