Memory statistics
The Memory Statistics view displays statistics about the application heap. It provides detailed information such as the number of classes loaded, the number of instances that are alive, and the memory size allocated by every class. Memory statistics are available at the package, class, and instance level.
To analyze the memory consumption, we have to rerun the application with another profiling option.

| Select Run Ć Profile Configurations. In the Profile Configurations dialog, select the EntityTester (preselected).
|
|
| In the Monitor tab, select Memory Analysis.
|
|
| Click Edit Options and select Track object allocation sites. Click Finish.
|
|
| Click Apply, then click Profile.
|
|
| A new entry opens in the Profiling Monitor view. The Console view shows the application output while it runs to completion.
|
|
| Double-click Memory Analysis, or click the Open Object Allocations view icon  . .
|
|
| The Object Allocations view displays live and total instances, active and total size, and average age (Figure | 7-17).
|
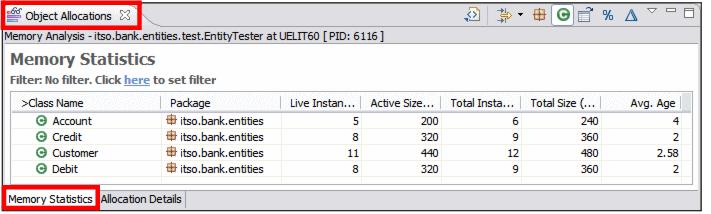
Figure 27-17 Object Allocations
|
| Select a class (Credit) and select the Allocation Details tab (Figure | 7-18).
|
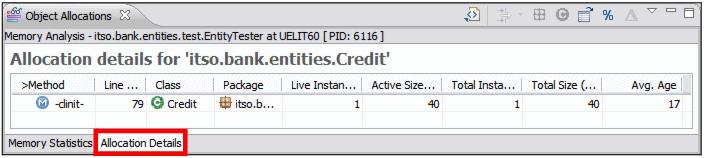
Figure 27-18 Object Allocation Details
|
| Click the Open Memory Statistics icon  . .
|

 Total Instances: Shows the total number of instances that had been created of the selected package, class, or method.
|
|
Live Instances: Shows the number of instances of the selected package, class, or method, where no garbage collection has taken place.
|
|
Collected: Shows the number of instances of the selected package, class, or method, that were removed during garbage collection.
|
|
Total Size: Shows the total size in bytes of the selected package, class, or method, of all instances that were created for it.
|
|
Active Size: Shows the total number of size of all live instances.
|
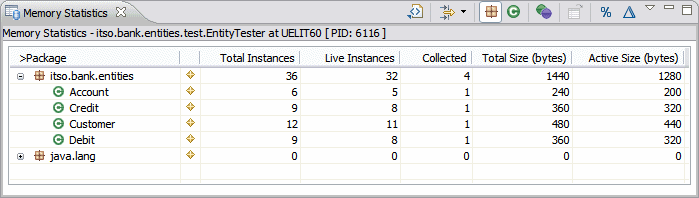
Figure 27-19 Memory Statistics
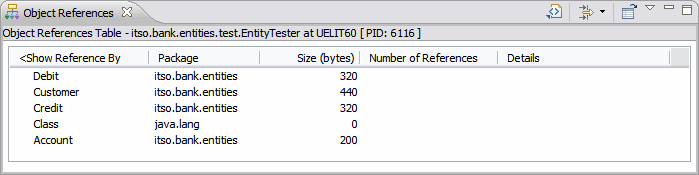
Figure 27-20 Object References
 (Figure | 7-20).