Execution flow
The Execution Flow view and table both show a representation of the entire program execution. In this view, the threads of the program fit horizontally, and time is scaled so that the entire execution fits vertically. In the table, the threads are grouped in the first column and time is recorded in successive rows.
In the Profiling Monitor view, click the Open Execution Flow icon  , or select Open With Æ Execution Flow (Figure | 7-29).
| The bottom pane displays the action sequence. Expand main and select the first main method. |
| The top pane shows the execution stripes (Figure | 7-15). |
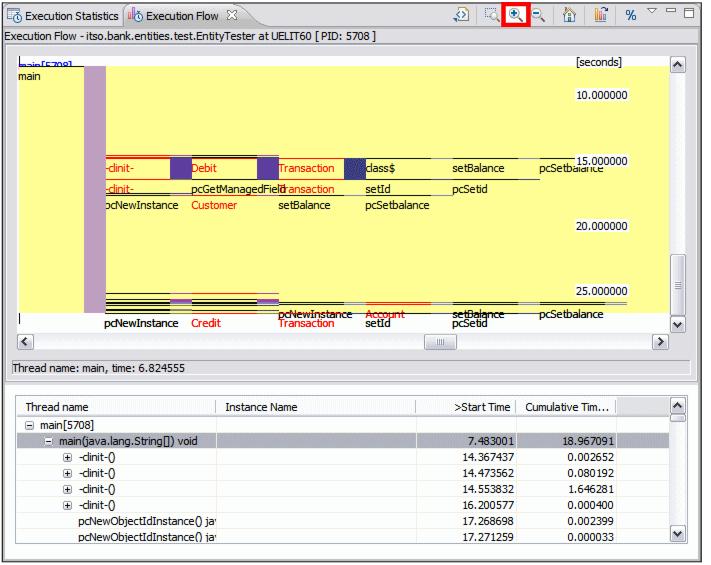
Figure 27-15 Execution Flow
Select the Zoom In icon  and click into the column to see more details. and click into the column to see more details.
|
|
ibm.com/redbooks |