Analyzing profiling data
We have now run the sample application that we want to collect data for. In this section, we analyze the collected data for execution statistics.
To display the collected data, we use the toolbar icons (Figure | 7-9). Alternatively, you can right-click the process and select Open With Æ statistic:

| 
|
| Open Execution Flow |
|
|
|
| Open Memory Statistics |
|
|
|
| Open Execution Statistics |
|
|
|
| Open Coverage Statistics |
|
|
|
| Open Object References |
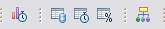
Figure 27-9 Profiling statistics icons
|
ibm.com/redbooks |