Creating a profiling configuration
We use the EntityTester class (in RAD75JPATest itso.bank.entities.test) as sample application. Refer to Testing JPA entities for a description of the EntityTester class.
| Right-click EntityTester and select Profile As Æ Profile Configurations. |
| In the Profile Configurations dialog, double-click Java Application, and an entry named EntityTester is added and opened. |
| In the Arguments tab, type 333-33-3333 as Program arguments, and -javaagent:<RAD_HOME>/runtimes/base_v7/plugins/com.ibm.ws.jpa.jar as VM arguments (Figure | 7-5). |
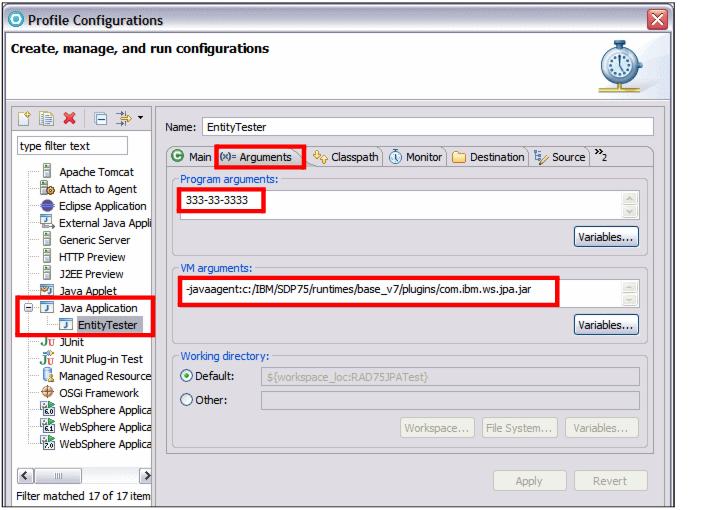
Figure 27-5 Profile Configuration: Arguments
| In the Monitor tab, select Execution Time Analysis (Figure | 7-6). |
|
Note: You can only select one analysis type. Refer to the Technote: http://www-01.ibm.com/support/docview.wss?uid=swg21328379 |
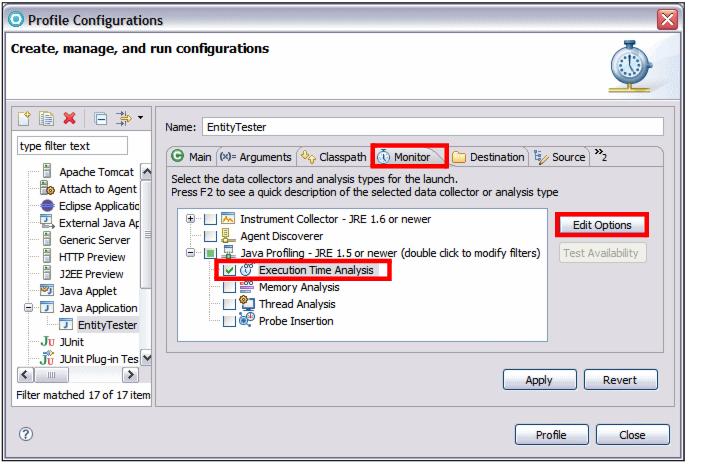
Figure 27-6 Profile Configuration: Monitor
| Click Edit Options, and in the Edit Profiling Options dialog, select Collect method CPU time information, and click Finish (Figure | 7-7). |
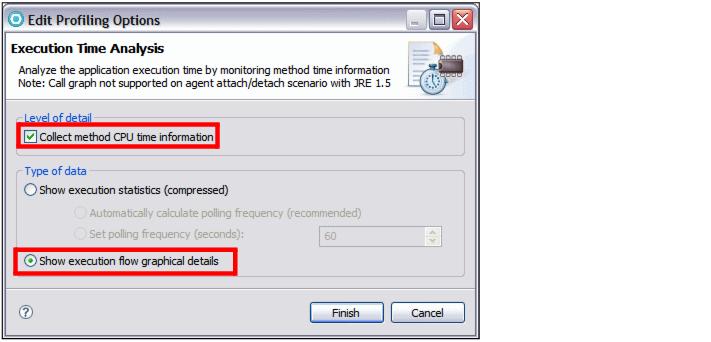
Figure 27-7 Profiling options for execution time analysis
| Click Apply to save the configuration. |
|
ibm.com/redbooks |