Profiling architecture
The profiling architecture that exists in Application Developer is based on the Eclipse Test & Performance Tools Platform (TPTP) project. More detailed information about the Eclipse TPTP project can be found at:
http://www.eclipse.org/tptp/
In the previous TPTP workbench, users required the services of the standalone Agent Controller before they could use the function in the Profiling and Logging perspective and in the Test perspective. Even when the user tried to profile a Java application locally or to run TPTP tests locally, the Agent Controller would have to be installed on the local machine.
The Integrated Agent Controller is a new feature in the TPTP workbench, which allows users to profile a Java application locally and to run a TPTP test locally without requiring the standalone Agent Controller on the local machine. Profiling on a remote machine or running a TPTP test on a remote machine still requires the Agent Controller on that remote machine.
This feature is packaged in the TPTP runtime install image and therefore no separate install step is required. The Integrated Agent Controller does not require any configuration at all. Unlike the Agent Controller, which requires the user to enter information, such as the path for the Java executable, the Integrated Agent Controller determines the required information from the Eclipse workbench during startup.
TPTP provides the Agent Controller daemon with a process for enabling client applications to launch host processes and interact with agents that exist within host processes. Figure | 7-1 shows the profiling architecture.
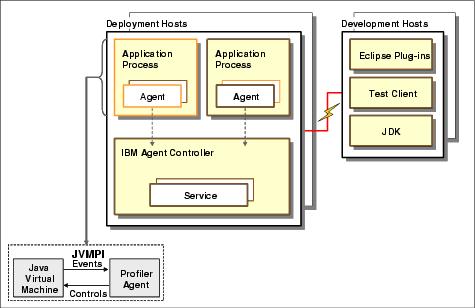
Figure 27-1 Profiling architecture of IBM Rational Application Developer
The definitions for the profiling architecture are as follows:
| Application process: The process that is executing the application consisting of the Java Virtual Machine (JVM) and the profiling agent. |
| Agent: The profiling component installed with the application that provides services to the host process, and more importantly, provides a portal by which application data can be forwarded to attached clients. |
| Test Client: A local or remote application that is the destination of host process data that is externalized by an agent. A single client can be attached to many agents at once, but does not always have to be attached to an agent. |
| Agent Controller: A daemon process that resides on each deployment host providing the mechanism by which client applications can either launch new host processes, or attach to agents coexisting within existing host processes. The Agent Controller can only interact with host processes on the same node. |
RAD v7.5 comes with an integrated agent controller, therefore, a separate install of the agent controller is not required.
| Deployment hosts: The host that an application has been deployed to and is being monitored for the capture of profiling agent. |
| Development hosts: The host that runs an Eclipse-compatible architecture such as Application Developer to receive profiling information and data for analysis. |
Each application process shown in Figure | 7-1 represents a JVM that is executing a Java application that is being profiled. A profile agent will be attached to each application to collect the appropriate runtime data for a particular type of profiling analysis. This profiling agent is based on the Java Virtual Machine Profiler Interface (JVMPI) architecture. More details on the JVMPI specification can be found at:
http://java.sun.com/j2se/1.4.2/docs/guide/jvmpi
The data collected by the agent is then sent to the Agent Controller, which then forwards this information to Application Developer for analysis and visualization.
There are two types of profiling agents available in Application Developer:
| Java Profiling Agent: This agent is based on the JVMPI architecture and is shown in Figure | 7-1. This agent is used for the collection of both standalone Java applications as well as applications running on an application server. |
| J2EE Request Profiling Agent: This agent resides in an application server process and collects runtime data for J2EE applications by intercepting requests to the EJB or Web containers. |
|
Note: There is only one instance of the J2EE Request Profiling agent that is active in a process that hosts WebSphere Application Server. |
|
ibm.com/redbooks |