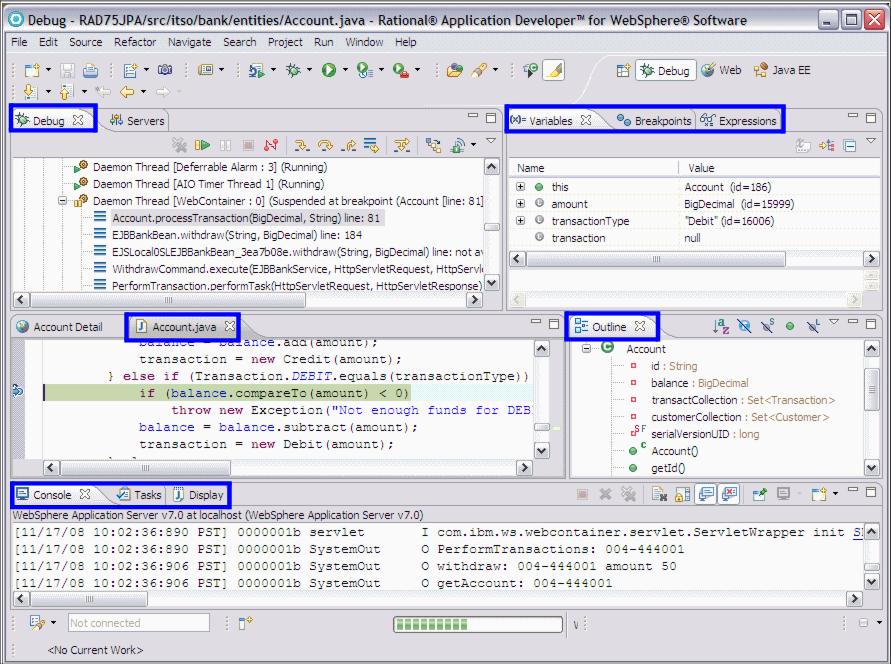
Views within the Debug perspective
When you run an application in debug mode and reach a breakpoint, you are prompted to switch to the Debug perspective. We recommend that you use the Debug perspective. Although you can debug in any perspective, the Debug perspective includes views that are the most helpful for debugging.
By default, when debugging Java, the views shown in the Debug perspective are as follows:

| Source view-Shows the file of the source code that is being debugged, highlighting the current line being executed.
|

| Outline view-Contains a list of variables and methods for the code listing shown in the display view.
|

| Debug view-Shows a list of all active threads, and a stack trace of the thread that is currently being debugged.
|

| Servers view-Useful if the user wants to start or stop test servers while debugging.
|

| Variables view-Given the selected source code file shown in the Debug view, the Variables view shows all the variables available to that class and their values. The variables view is, by default, structured into columns. The use of columns can be toggled from the Layout Ć Show Columns menu option from the drop-down arrow menu in the Variables view. Also, step-by-step debugging variables that change value are highlighted in a different color.
|

| Breakpoints view-Shows all breakpoints in the current workspace and gives a facility to activate/de-activate them, remove them, change their properties, and to import/export a set of them to other developers.
|

| Display view-Allows the user to execute any Java command or evaluate an expression in the context of the current stack frame.
|

| Expressions view-During debugging, the user has the option to inspect or display the value of expressions from the code or even evaluate new expressions. The Expressions view contains a list of expressions and values which the user has evaluated and then selected to track.
|

| Console view-Shows the output to System.out.
|

| Tasks view-Shows any outstanding source code errors, warnings or informational messages for the current workspace.
|

| Error Log-Shows all errors and warnings generated by plug-ins running in the work space.
|
Figure | -1 shows an application stopped at a breakpoint in the Debug perspective.

Figure 24-1 Typical application running in the Debug perspective


