Details
At the end of the Check User Path process, the Details tab is displayed containing the statistics for the User Path that has just been checked.
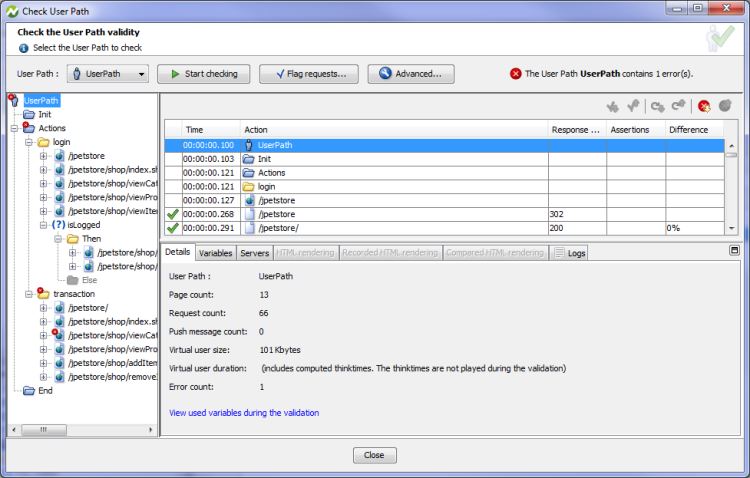
The Details tab includes the following information:
- User Path gives the name of the User Path checked.
- Page count is the number of pages played during the checking process.
- Request count is the number of requests played during the checking process.
- Push message count is the number of Push messages played during the checking process.
- Virtual User size is the overall size of all the pages played during the checking process (sum of the sizes of all the server responses).
- Virtual User duration is the total time taken to execute the Virtual User. During the User Path check, think times are not played by default. However, the Virtual User duration includes the calculated think times to reflect the actual time that will be taken by the User Path during the test.
- Error count is the total number of requests containing errors (HTTP and validation errors).
- View used variables during the validation is the link to view the variables used and extracted during the checking process.
To play think times when checking the User Path, see Advanced parameters.
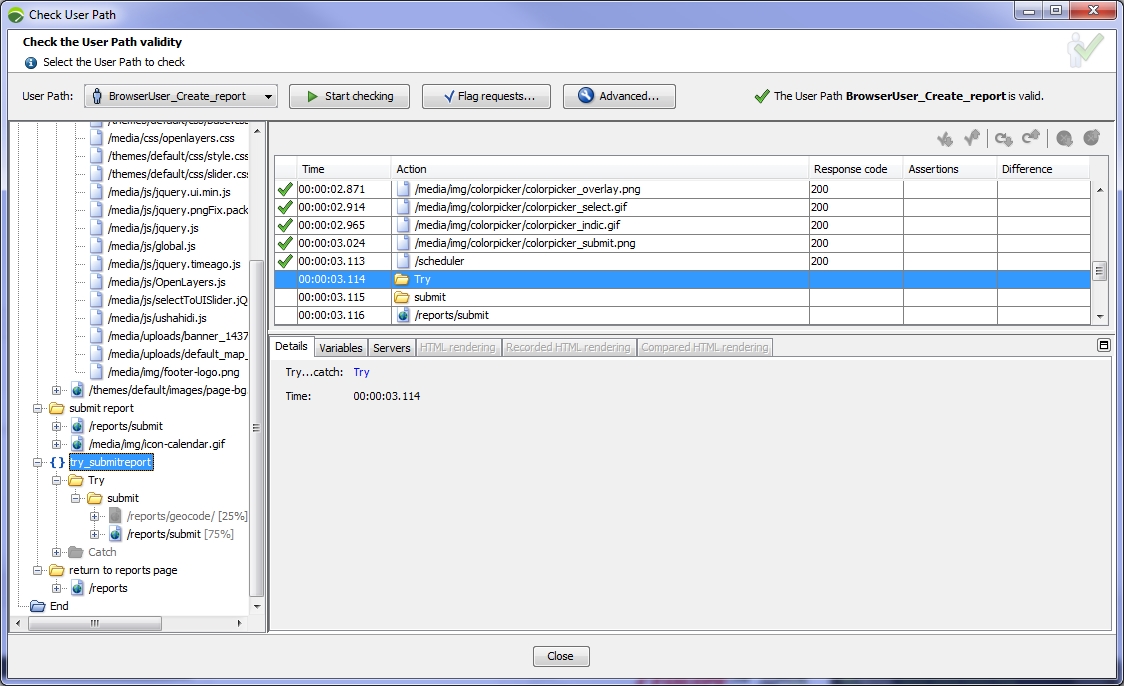
The Details tab displays other statistics according to the item selected in the tree view: Transaction, Page, Request, or (Logical) Action.
Containers
When a Container is selected in the Check Virtual User tree view, the Details tab lists statistics about that Container.
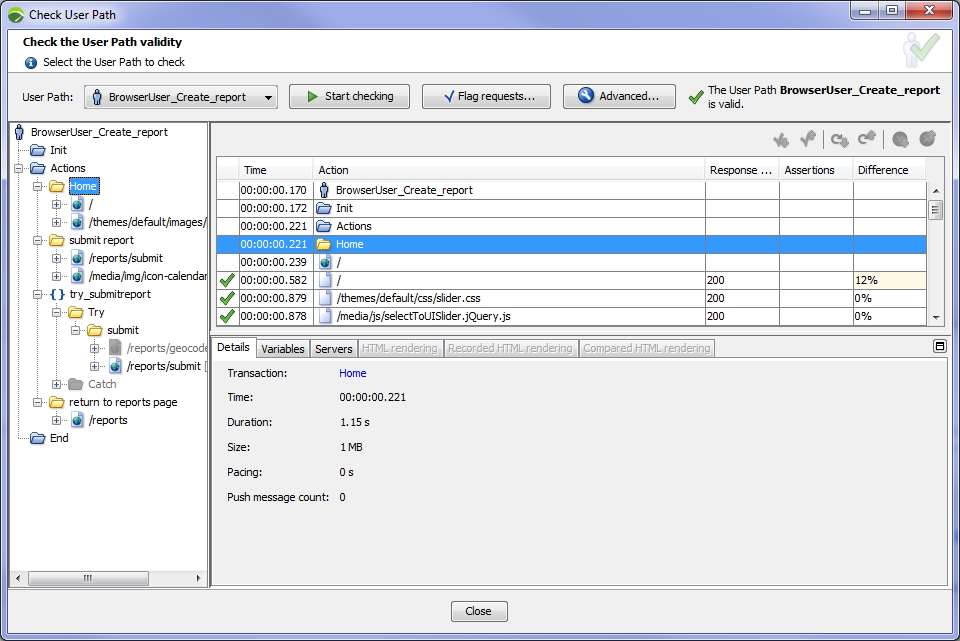
The summary includes the following information:
- Container is the name of the Container. A click on the Container name makes it possible to locate the Container in the Design section.
- Time is the time when the Container was executed.
- Duration is the time length of the Container execution.
- Size is the overall size of all the pages played in the Container during the checking process (sum of the sizes of all the server responses).
- Pacing is the minimum time the Container took to execute.
- Push message count is the number of Push messages received from the server.
Pages
When a page is selected in the User Path tree view, the Details tab lists statistics about that page.
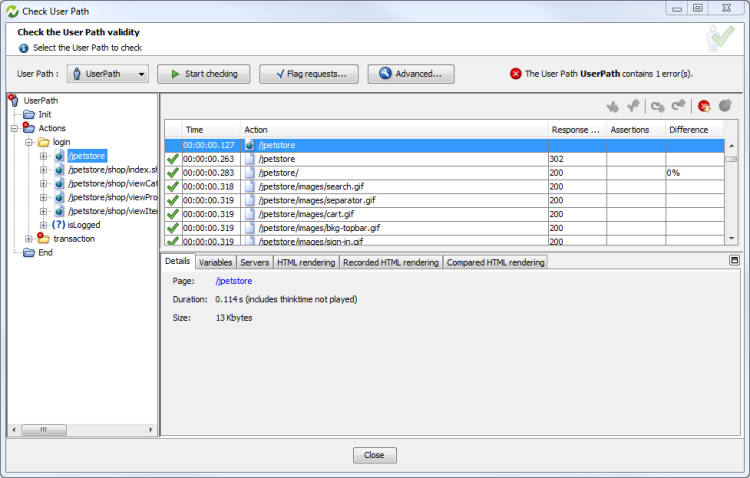
- Tip: For quick and easy selection, the page name is linked to the User Path.
The summary includes the following information:
- Page is the name of the page. A click on the page name makes it possible to locate the page.
- Duration is the duration of the selected page including think time—not played during the checking process. As some requests are played concurrently, the page duration is not the sum of the request response times.
- Size is the sum of the sizes of all the requests in the page.
Requests
When a request is selected in the User Path tree view, the Details tab lists statistics about that request.
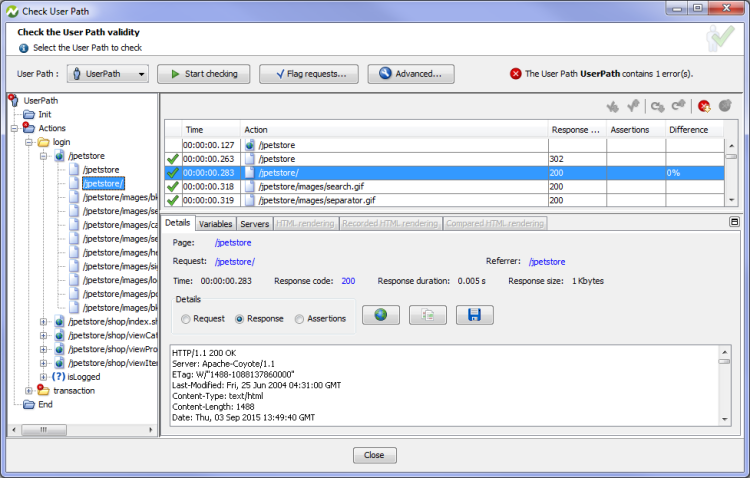
For each request, a detailed analysis can be made on the request sent by NeoLoad, the server response and any assertions. To do this, it is only required to click on the request in the table and select the detail to be displayed (Request, Response, Assertions, and Variables) in the Details group box.
- Tip: For quick and easy selection, the request and page names are linked to the User Path.
The summary includes the following information:
- Page is the name of the page which contains the request. A click on the page name makes it possible to locate the page.
- Request is the name of the request. A click on the request name makes it possible to locate the request.
- Referrer is the request which precedes the displayed request, when a redirection occurred.
- Time is the time when the request was executed.
- Response code is status code of the response returned by the server. A click on the code makes it possible to display the definition of the status code in the online help.
- Response duration is the time length of the request execution.
- Response size is the size of the response to the request.
- Details makes it possible to view the following contents:
- Request is the option to display the content of the request sent to the server.
- Response is the option to display the content of the response returned by the server.
- Assertions is the option to display the list of all the conditions set on the server response.
The Open in browser button displays a selected server response in a browser window. In this case, NeoLoad opens a browser that displays the page containing the server response returned during the checking process. This allows previewing the page itself, rather than viewing the HTML source code. Images are not displayed during this preview, as only the HTML code for the current request is sent to the browser.
The Compare with recording button is useful to compare the request and server response with those recorded. See requests and responses" href="966.htm">Compare requests and responses.
The Save as button allows recording the content of a request or a response displayed in the Details group box for further analysis.
Logical Actions
When a logical action is selected in the Check Virtual User tree view, the Details tab lists statistics about that logical action.
The tab displays all the information about the configuration of the selected conditional structure. See Logical actions.