MongoDB
Supported versions
NeoLoad supports MongoDB 2.2 and later.
The MongoDB REST interface must be enabled with --rest --httpinterface (only with --rest for 2.x MongoDB versions) from the MongoDB server command line. It is necessary to ensure that the nohttpinterface parameter is set to false otherwise it overrides the rest parameter.
For 2.6 and later MongoDB versions, the equivalent YAML-based configuration is:
net:
http:
enabled: true
RESTInterfaceEnabled: true
Do not use tabs, only spaces are accepted.
See:
- 2.4 - REST MongoDB documentation
- 2.6 - REST MongoDB documentation
- 3.0 - REST MongoDB documentation
- 3.2 - REST MongoDB documentation
For replica sets, make sure that read operations are allowed on secondary members with rs.slaveOk() command. Click here to learn more.
Connection settings
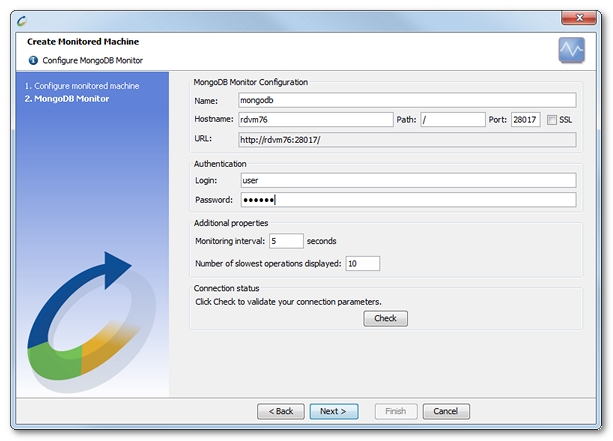
MongoDB monitors allow monitoring MongoDB database servers. The counters are sorted by category: operations, memory, and so on.
- Warning: When the MongoDB server or when a front-end reverse proxy server requires users to authenticate, NeoLoad also requires the authentication account to connect to the database and to read all these views.
Create a MongoDB monitor
NeoLoad makes it possible to create a new monitor either using the monitored machine creation wizard, as described in Create and configure a monitored machine, or from an existing monitored machine, as described in Create and configure a monitor.

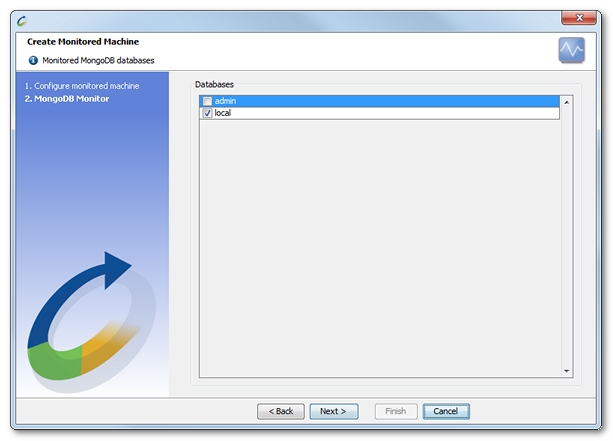
After defining the MongoDB monitor, the wizard displays the list of the databases to monitor.

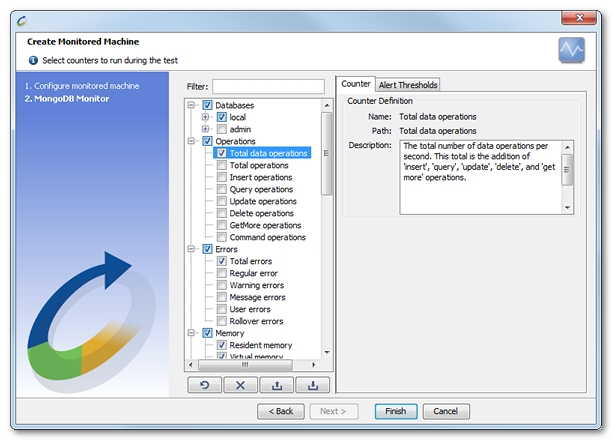
Choosing a specific database automatically selects the default counters for this database.

Available counters
- Warning: Some counters —and categories— are related to the server configuration. For example replication, journaling, slow operations, and so on. They are available only when the server uses them.
- database.
- memory.
- disk-space. "Disk space" is the total size of the files that hold the database (is equal to the data files + namespace files for the database).
- index-size. "Index size" is the total size of all indexes created on this database.
- data-size. "Data size" is the total size of the data held in this database including the padding factor.
- storage-size. "Storage size" is the total amount of space allocated to collections in this database for document storage.
- locks.
- write. The "Write lock %" reports the percentage of time that the database has held the database write lock (only for 2.x MongoDB versions).
- read. The "Read lock %" reports the percentage of time that the database has held the database read lock (only for 2.x MongoDB versions).
- page-faults.
- not-in-memory. The "Accesses not in memory" is the number of times per second an access to a memory page was not resident in memory for the database (only for 2.x MongoDB versions).
- exceptions. The "Page fault exceptions thrown" is the number of page fault exceptions thrown per second (when accessing data for the database) (only for 2.x MongoDB versions).
- slow-operations. "Slow operations" is a list of the slowest operations which occurred during the test (this list is populated at the end of the test). These slowest operations are per database. The MongoDB server profiling configuration defines what a slow operation is.
- date. The date of the slow operation.
- operation. The type of operation. The possible values are: "insert", "query", "update", "remove", "getmore" and "command".
- collection. The collection the operation targets (can be empty in case of a "command" operation).
- query. The query document used (only specified in case of a "query" operation).
- command. The command operation (only specified in case of a "command" operation).
- update-object. The update document passed in during an "update" operation.
- duration. The time in milliseconds for the server to perform the operation. This time does not include network time nor time to acquire the lock.
- memory.
- operations.
- data.total. The total number of data operations per second. This total is the addition of "insert", "query", "update", "delete", and "get more" operations.
- total. Total operations. This total operations per seconds is the addition of the number of data operations per second and the number of command operations per second.
- insert. "Insert operations" provides a counter of the total number of "insert" operations per second.
- query. "Query operations" provides a counter of the total number of queries per second.
- update. "Update operations" provides a counter of the total number of "update" operations per second.
- delete. "Delete operations" provides a counter of the total number of "delete" operations per second.
- get-more. "GetMore operations" provides a counter of the total number of "getmore" operations per second.
- command. "Command operations" provides a counter of the total number of "command" operations per second.
- errors.
- total. "Total errors" is the total of errors (assertions) raised per second ( "regular" + "warning" + "message" + "user" + "rollover").
- regular. "Regular error" tracks the number of regular errors (assertions) per second.
- warning. "Warning errors" tracks the number of warnings per second.
- message. "Message errors" tracks the number of message errors (assertions) per second.
- user. "User errors" tracks the number of user errors (assertions) per second.
- rollover. "Rollover errors" displays the number of times per second that the rollover counters have rolled over.
- memory.
- resident. The value of "Resident" is roughly equivalent to the amount of RAM, in megabytes, currently used by the database process. In normal use this value tends to grow. In dedicated database servers this number tends to approach the total amount of system memory.
- virtual. "Virtual" displays the quantity, in megabytes, of virtual memory used. With journaling enabled, the value of virtual is at least twice the value of mapped.
- mapped. The value of "Mapped" provides the amount of mapped memory, in megabytes, by the database. Because MongoDB uses memory-mapped files, this value is likely to be to be roughly equivalent to the total size of your database or databases.
- mapped-with-journal. "Mapped with journal" provides the amount of mapped memory, in megabytes, including the memory used for journaling. This value will always be twice the value of mapped. This field is only included if journaling is enabled.
- non-mapped. "Non mapped" provides the amount of non-mapped memory, in megabytes, by the database. "Non mapped" is the difference between virtual and mapped memory (or mapped with journal memory in case journaling is enabled).
- disk-space. "Disk space" is the total size of the files that hold the databases (is equal to the data files + namespace files for all the databases).
- index-size. "Index size" is the total size of all indexes created on all databases.
- data-size. "Data size" is the total size of the data held in all databases including the padding factor.
- storage-size. "Storage size" is the total amount of space allocated to collections in all databases for document storage.
- locks.
- write. The "Write lock %" reports the percentage of time that all databases have held the global write lock (only for 2.x MongoDB versions).
- read. The "Read lock %" reports the percentage of time that all databases have held the global read lock (only for 2.x MongoDB versions).
- index.
- accesses. "Accesses" reports the number of times per second that operations have accessed indexes. This value is the combination of the hits and misses. Higher values indicate that your database has indexes and that queries are taking advantage of these indexes. If this number does not grow over time, this might indicate that your indexes do not effectively support your use.
- hits. The "Hits" value reflects the number of times per second that an index has been accessed and returned from memory.
- misses. The "Misses" value represents the number of times per second that an operation attempted to access an index that was not in memory. These misses do not indicate a failed query or operation, but rather an inefficient use of the index. Lower values in this field indicate better index use and likely overall performance as well.
- miss-ratio. The "MissRatio" value is the percentage ratio of "hits" to "misses" misses.
- queue.
- percentage. "Queue %" is the percentage of the percentage ratio of "operations queued" to "total data operations".
- total. The value of "Queue" provides the combined total of current operations queued waiting for the lock.
- writers. The value of "Writers queue" is the number of operations that are currently queued and waiting for the write-lock. A consistently small write-queue, particularly of shorter operations is no cause for concern.
- readers. The value of "Readers queue" is the number of operations that are currently queued and waiting for the read-lock. A consistently small read-queue, particularly of shorter operations should cause no concern.
- flushing. (only for MMAPv1 Storage Engine)
- average-duration. The "Flushing average duration" value describes the relationship between the number of flushes and the total amount of time that the database has spent writing data to disk. The larger flushes is, the more likely this value is likely to represent a "normal" time; however, abnormal data can skew this value. Use the "Last duration" to ensure that a high average is not skewed by transient historical issue or a random write distribution.
- last-duration. The value of the "Flushing last duration" field is the amount of time, in milliseconds, that the last flush operation took to complete.
- connections.
- total. The value of "Total active connections" is the total number of active client connections to the database. This combines clients that are performing read operations (e.g. "Readers") and clients that are performing write operations (e.g. "Writers").
- readers. The value of "Reader connections" contains a count of the active client connections performing read operations.
- writers. The value of "Writer connections" contains a count of active client connections performing write operations.
- cursors.
- opened. "Total opened" provides the number of cursors that MongoDB is maintaining for clients. Because MongoDB exhausts unused cursors, typically this value small or zero. However, if there is a queue, stale tailable cursors, or a large number of operations this value may rise.
- timed-out. "Timed out cursors" provides a counter of the total number of cursors that have timed out per second. If this number is large or growing at a regular rate, this may indicate an application error.
- network.
- bytes-in. The value of the "KBytes in" field reflects the amount of network traffic, in kbytes per second, received by this database.
- bytes-out. The value of the "KBytes out" field reflects the amount of network traffic, in kbytes per second, sent from this database.
- requests. The "Number of network requests" field is a counter of the total number of distinct requests that the server has received.
- page-faults.
- system-number. The "System page faults" field reports the total number of page faults that require disk operations. System page faults refer to operations that require the database server to access data which is not available in active memory. The "System page faults" counter may increase dramatically during moments of poor performance and may correlate with limited memory environments and larger data sets. Limited and sporadic page faults do not necessarily indicate an issue.
- accesses-not-in-memory. "Accesses not in memory" reflects the number of times per second a memory page was not resident in memory for all databases (only for 2.x MongoDB versions).
- accesses-not-in-memory-ratio. The "Accesses not in memory %" value is the percentage ratio of "Accesses not in memory" to "Total data operations" (only for 2.x MongoDB versions).
- exception. "Page fault exceptions thrown" reflects the number of page fault exceptions thrown per second when accessing data for all databases (only for 2.x MongoDB versions).
- journaling.
- write-lock-commits. "Commits in write lock" provides a count per second of the commits that occurred while a write lock was held. Commits in a write lock indicate a MongoDB server under a heavy write load and call for further diagnosis.
- journaled-size. "Journaled size" provides the amount of data in megabytes written to journal during the last journal group commit interval.
- write-to-data-files. "Written to data files size" provides the amount of data in megabytes written from journal to the data files during the last journal group commit interval.
- replication.
- lag. "Replication lag" is the delay in milliseconds between the time an operation occurs on the primary and the time that same operation gets applied on the secondary.
- max-lag. "Max Replication lag" is the worst delay in milliseconds between the time an operation occurs on the primary and the time that same operation gets applied on one of the secondaries.
- oplog-length. The oplog (operations log) is a special capped collection that keeps a rolling record of all operations that modify the data stored in your databases. MongoDB applies database operations on the primary and then records the operations on the primary oplog. Finally "Oplog length" corresponds to the difference between the first and the last timestamp operation in the "oplog": this duration is in hours.
- maximum-oplog-size. "Maximum oplog size" is the maximum size in megabytes of the oplog defined by the MongoDB server.
- used-oplog-size. "Used oplog size" is the used oplog size in megabytes.
- free-oplog-size. Free oplog size is equals to "Maximum oplog size" - "Used oplog size" (in megabytes).