Runtime overview
The Runtime overview tab displays the following statistics:
|
Name |
Description |
|---|---|
|
Scenario Name |
Name of the scenario currently running |
|
Start Time |
Scenario start date |
|
Elapsed Time |
Time elapsed since test started |
|
Total Hits |
Total number of hits since test started |
|
Total Throughput |
Total number of megabytes received from server |
|
Total Errors |
Total number of errors since test started |
|
Total Alerts |
Total number of alerts since test started |
|
Total Users Launched |
Total number of Virtual Users launched since test started, including those currently running. |
|
Total Iterations Completed |
Total number of times when the Actions Container has been executed since test started. |
|
Average Response Time (requests) |
Average response time for HTTP requests since test started |
|
Average Response Time (pages) |
Average response time for web pages since test started |
|
Average Hits/sec. |
Average hits/sec. since test started |
|
Average Throughput |
Average throughput since test started |
|
Current Response Time (requests) |
Average request response time for HTTP requests over the last second |
|
Current Response Time (pages) |
Average request response time for web pages over the last second |
|
Current Hits/sec. |
Average hits/sec. for HTTP requests over the last second |
|
Current Throughput |
Average throughput over the last second |
|
Current Users Count |
Number of Virtual Users currently running |
Graphs
The main statistics are plotted in real time: number of Virtual Users currently running, error rate (errors/sec.), number of alerts, hits/sec. and average request response time.
Controller
Two metrics monitor the Controller activity:
Controller CPU Load: CPU load for the machine hosting the Controller.
Controller Memory used: Memory used, expressed as a percentage of the memory allocated to the Controller program.
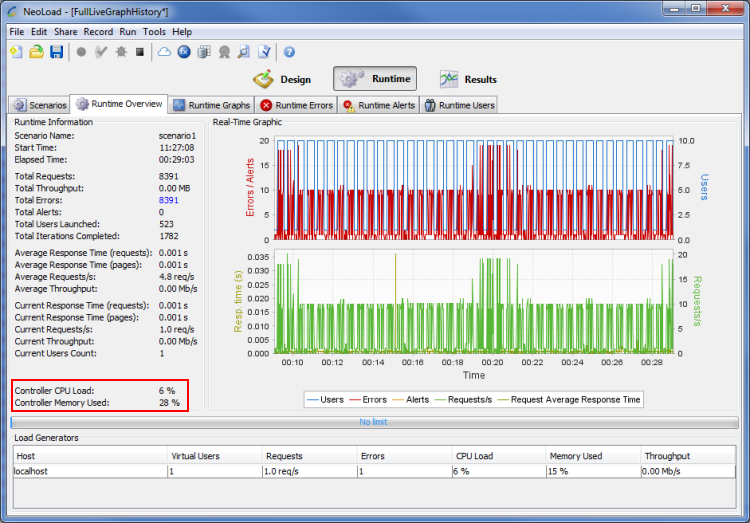
Load Generators
- Host: Machine running the Load Generator.
- Virtual Users: Number of Virtual Users currently being run by that Load Generator.
- Hit Rate: Average hit rate generated by that Load Generator.
- Errors: Current error rate (number of errors per second).
- CPU Load: CPU load for the machine hosting the Load Generator.
- Memory Used: Memory used, expressed as a percentage of the memory allocated to the Load Generator program (the program default memory allocation is 384Mb).
- Throughput: Throughput in Megabits per second for the network interface used on the Load Generator.
If the CPU Load or Memory Used figure regularly exceeds 90%, this indicates that the Load Generator is overloaded. Run the test with fewer Virtual Users or a longer think time, or use additional Load Generators.