Apache
Configuration
Apache monitors allow monitoring any server that publishes a web page in the compatible format. Whatever the application or application server (J2EE, PHP, .Net...), it is necessary to develop a specific page in order to publish the custom counters. See Use custom counters.
Configure the Apache server
- For NeoLoad to be able to retrieve data from an Apache server, the mod_status module must be enabled. To do this, it is necessary to edit the httpd.conf file and include the commented out line:
LoadModule status_module modules/mod_status.so
- To restrict access to the status report to machines on the foo.com domain, the following code must be added to the httpd.conf configuration file:
<Location /server-status>
SetHandler server-status
Order Deny,Allow
Deny from all
Allow from .foo.com
</Location>
- Enabling extended statistics is recommended. This is done by editing the ExtendedStatus setting in the httpd.conf file.
To check the Apache configuration, access the address http://<your.server.name>/server-status from the NeoLoad Controller machine. A page with the Apache server statistics should be displayed.
Configure the Nginx server
For NeoLoad to be able to retrieve data from a Nginx server, the HttpStubStatusModule module must be enabled. This module provides the ability to get some status from Nginx:
- Number of all open connections
- Statistics about accepted connections
- Connections per second and so on
To do this, it is necessary to edit the nginx.conf file:
# vi nginx.conf
The following code must be added or appended in context location:
location /nginx_status {
# Turn on stats
stub_status on;
access_log off;
# only allow access from 192.168.1.5 #
allow 192.168.1.5;
deny all;
}
The file must be saved and closed before reloading the Nginx server:
# service nginx reload
or
# nginx -s reload
To check the Nginx configuration, access the address http://<your.server.name>/nginx_status from the NeoLoad Controller machine. A page with the Nginx server statistics should be displayed.
Use custom counters
To monitor a server other than an Apache, it is necessary to develop a page containing the counters to be monitored. This page must return the data in the format name: value, the value being numeric.
Example:
nameCounter1: 10
nameCounter2: -23.567
nameCounter2: +17.33
...
During the monitoring phase, NeoLoad queries the server regularly and records the counters values.
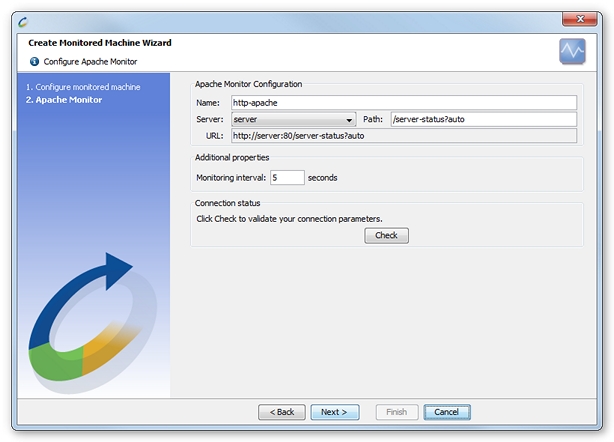
Connection settings
The monitor definition requires a server (defined in the Servers section of the User Paths) and a path. A server can be created in the Servers section, or one already created during a recording can be used.
Create an Apache monitor
NeoLoad makes it possible to create a new monitor either using the monitored machine creation wizard, as described in Create and configure a monitored machine, or from an existing monitored machine, as described in Create and configure a monitor.
Available counters
Advanced settings are available for all HTTP monitors. These settings determine how the monitor values are calculated and sampled. See Advanced settings - Counter/Indicator.
Apache Web server
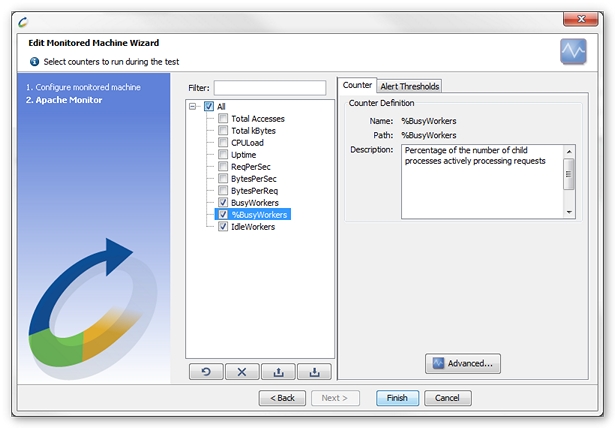
When extended statistics are enabled (ExtendedStatus setting in the httpd.conf file set to On), the available counters are:
- Total Accesses. Total access count since the server started
- Total kBytes. Total volume delivered in bytes since the server started
- Uptime. Time during which the server was running
- ReqPerSec. Average number of requests per second since the server started
- BytesPerSec. Average number of bytes delivered per second
- BytesPerReq. Average number of bytes per request
Default counters are:
- BusyWorkers. Number of child processes actively processing requests
- %BusyWorkers. Percentage of the number of child processes actively processing requests
- IdleWorkers. Number of child processes idle
Other Web servers
The available counters are those that follow the counterName: counterValue syntax and whose value is an integer or a real number.