RSTAT
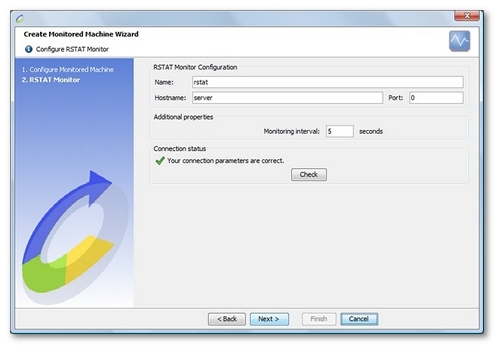
Connection settings
RSTAT monitors allow monitoring the rpc.rstatd daemon counters. This daemon is already installed and running on most Solaris and Linux machines.
This protocol uses RPC calls. Its disadvantage is that it is blocked by most firewalls as it uses port 111, the RPC port, which generally is blocked by default. This port may need to be opened to allow NeoLoad to access the rstatd daemon.
The default connection port set by NeoLoad is 0. This setting causes NeoLoad to automatically search for the RPC port used by the remote machine.
Create a RSTAT monitor
NeoLoad makes it possible to create a new monitor either using the monitored machine creation wizard, as described in Create and configure a monitored machine, or from an existing monitored machine, as described in Create and configure a monitor.

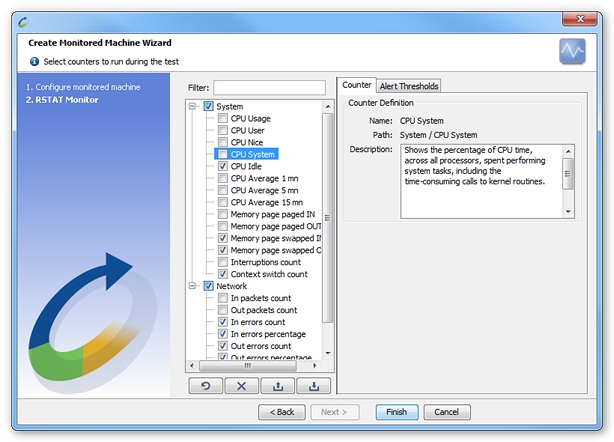
Available counters

- System.
- CPU Usage. The percentage of CPU time, for all processors globally, taken up executing user commands, and carrying out system tasks and I/O operations. This counter takes into account the total number of processors in its calculation of CPU usage.
- User CPU. The percentage of CPU time, for all processors globally, taken up executing user commands. This counter shows the CPU usage per user globally across all the processors.
- Nice CPU. The percentage of CPU time, for all processors globally, taken up by low-priority processes. The time taken up by "nice" tasks is already taken into account in the System CPU and User CPU times.
- System CPU. The percentage of CPU time, for all processors globally, taken up executing system tasks, including system calls to kernel routines.
- Idle CPU. The percentage of idle CPU across all processors.
- CPU Average 1 mn. The average usage of CPU time during the last minute. This counter shows the CPU usage globally across all the processors.
- CPU Average 5 mn. The average usage of CPU time during the last 5 minutes. This counter shows the CPU usage globally across all the processors.
- CPU Average 15 mn. The average usage of CPU time during the last 15 minutes. This counter shows the CPU usage globally across all the processors.
- Memory Page paged IN. The number of pages moved from the disk into cache memory.
- Memory Page paged OUT. The number of pages moved from cache memory to the disk.
- Memory Page swapped IN. The number of pages moved from swap space to storage space
- Memory Page swapped OUT. The number of pages moved from storage space to swap space.
- Interruptions count. The number of interruptions occurring during a monitoring interval.
- Context switch count. The number of processor context changes per second.
- Network.
- IN packets count. The number of network packets entering per second.
- OUT packets count. The number of network packets exiting per second.
- IN errors count. The total number of network errors inbound per second.
- In errors percentage. Shows the percentage of incoming network errors that occurred during the monitoring interval.
- OUT errors count. The total number of network errors outbound per second.
- Out errors percentage. Shows the percentage of outgoing network errors that occurred during the monitoring interval.
- Collisions count. The number of network collisions occurring during the monitoring interval. A collision is an undesirable event resulting from competing network packets being transmitted over a same channel.
- Collisions percentage. Shows the percentage of network collisions that occurred during the monitoring interval. A collision is an undesirable event resulting from competing network packets being transmitted over a same channel.