Solaris
Supported versions
The Solaris monitor has been validated on Solaris 10.
Connection settings
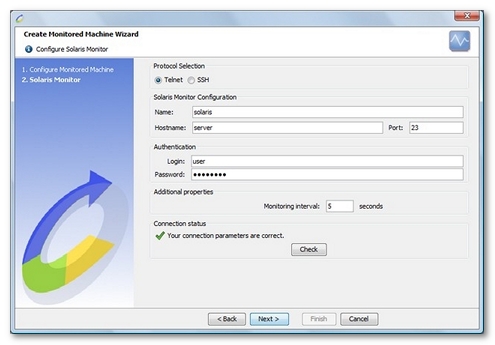
When creating a new monitor of this type, the protocol must be specified (Telnet or SSH).
Defining a Solaris connection to a server requires the name or IP address of the machine to be monitored, as well as the connection port. The standard access ports are port 23 for the Telnet protocol and port 22 for the SSH protocol.
A valid user account also must be entered to allow NeoLoad to connect to the server and retrieve the performance counters to be monitored. NeoLoad can open up to three Telnet/SSH connections to the server, depending on the counters to be monitored.
- Warning: With some configurations, repeated connections to the server using the same account (e.g. root account) may not be possible. If this is the case, and depending on the counters selected, certain counters may not function.
Specificities of the SSH protocol
NeoLoad supports the following authentication methods: login / password, private key / public key and Keyboard-Interactive.
On certain systems, the authentication must be configured in the SSH configuration file. If the connection parameters are correct, and the authentication fails, check the SSH configuration in the file /etc/ssh/sshd_config. Check to make sure that one of the following parameters has the value yes: PasswordAuthentication, PubkeyAuthentication or PAMAuthenticationViaKbdInt. The SSH service needs to be restarted for any change to take effect.
NeoLoad also supports the following encryption algorithms (ciphers): aes128-cbc, aes128-ctr, aes192-cbc, aes256-cbc, 3des-cbc, 3des-ctr, blowfish-cbc, arcfour, arcfour128, twofish-cbc, twofish128-cbc, twofish192-cbc, twofish256-cbc, and cast128-cbc.
- Warning: The use of encryption algorithms in certain states may be subject to restrictions.
Lastly, NeoLoad supports the following message authentication codes (MAC): hmac-sha1, hmac-sha1-96, hmac-md5, and hmac-md5-96.
Create a Solaris monitor
NeoLoad makes it possible to create a new Monitor either using the monitored machine creation wizard, as described in Create and configure a monitored machine, or from an existing monitored machine, as described in Create and configure a monitor.

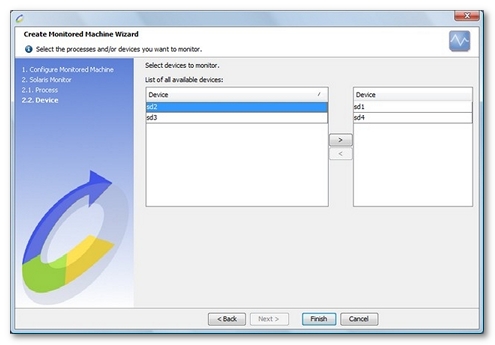
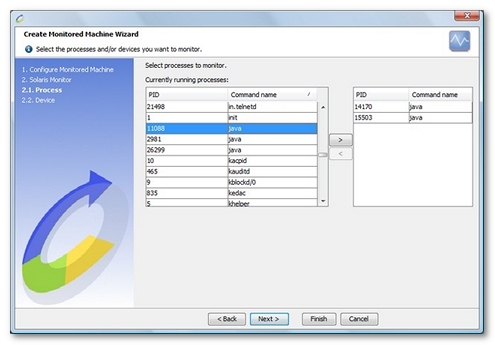
Depending on the type of counter selected, NeoLoad displays additional steps to select the hard disks (Disk (per device) category counter) and processes (Process (per process) category counter) to be monitored.


Available counters

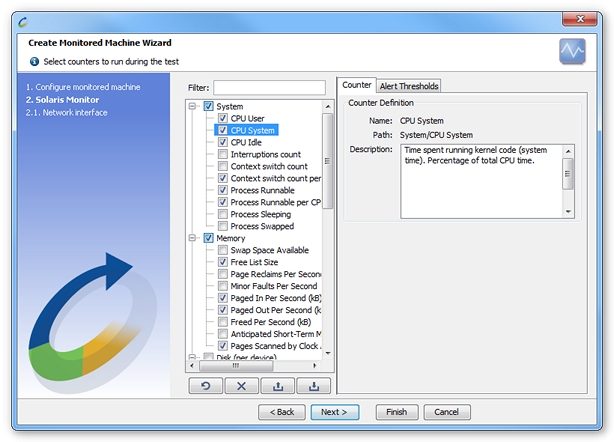
The counters available on Solaris operating system are listed here.
- System.
- CPU User. Time spent running non-kernel code (user time, including nice time). Percentage of total CPU time.
- CPU System. Time spent running kernel code (system time). Percentage of total CPU time.
- CPU Idle. Time spent idle. Percentage of total CPU time.
- Interruptions Count. The number of interrupts per second, including the clock.
- Context Switch Count. The number of context switches per second.
- Context Switch Count per CPU. The number of context switches per second per CPU.
- Processes Runnable. The number of processes waiting for run time.
- Processes Runnable per CPU. The number of processes waiting for run time per CPU.
- Processes Sleeping. The number of processes in uninterruptible sleep.
- Processes Swapped. The number of processes swapped out but otherwise runnable. This field is calculated; however, Linux never desperation swaps.
Warning: The field is available on some Linux systems only (w field in the proc section of the vmstat command).
- Memory.
- Swap Space Available. Amount of swap space currently available (Kbytes).
- Free List Size. Size of the free list (Kbytes).
- Page Reclaims Per Second. Report information about page faults: page reclaims per second.
- Minor Faults Per Second. Report information about page faults: minor faults.
- Paged In Per Second. Kilobytes paged in per second.
- Paged Out Per Second. Kilobytes paged out per second.
- Freed Per Second. Kilobytes freed per second.
- Anticipated Short-term Memory Shortfall. Anticipated short-term memory shortfall (Kbytes) per second.
- Pages Scanned by Clock Algorithm. Pages scanned by clock algorithm per second.
- Disk. The disk section counters are available per device. Outside the wizard, select the device in the counter definition pane. A device picker is available using the Fill devices button. All the Disk counters need the iostat command installed on the server system. This command is a part of the sysstat package. Please make sure that this command is available before using those counters.
- Disk Read. The number of read requests merged per second issued to the device.
- Disk Write. The number of write requests merged per second issued to the device.
- Disk Read (KB). The number of Kilobytes read per second.
- Disk Write (KB). The number of Kilobytes written per second.
- Transaction waiting for service. Average number of transactions waiting for service (queue length).
- Average number of transaction. Average number of transactions actively being serviced (removed from the queue but not yet completed)
- Average response time. Average response time of transactions, in milliseconds (the time that transactions are in the queue and the time that transactions are being serviced)
- Percent time waiting. Percent of the time there are transactions waiting for service (queue non-empty).
- Percent time busy. Percent of time the disk is busy (transactions in progress).
- Processes. The processes section counters are available per process. Select the process identifier in the counter definition pane. A process identifier picker is available using the selection button.
- Process Memory Usage. Resident size (kb). The non-swapped physical memory a task has used.
- Process CPU Time. The task share of the elapsed CPU time since the last update, expressed as a percentage of total CPU time.
- Network (per interface). The network section counters are available per interface. Outside the wizard, select the interface name in the counter definition pane. A network interface picker is available using the Populate button.
- Incoming bytes/s. The number of bytes received by the network interface per second.
- Incoming packets/s. The number of packets received by the network interface per second.
- Incoming packet errors/s. The number of broken packets received by the network interface per second.
- % Incoming packet errors. Percentage of broken packets received by the network interface (% Incoming packet errors = Incoming packet errors / Incoming packets *100).
- Outgoing bytes/s. The number of bytes issued by the network interface per second.
- Outgoing packets/s. The number of packets issued by the network interface per second.
- Outgoing packets errors/s. The number of broken packets issued by the network interface per second.
- % Outgoing packet errors. Percentage of packets issued by the network interface and considered broken (% Outgoing packet errors = Outgoing packet errors / Outgoing packets *100).
- Packet collisions. The number of packet collisions discovered by the network interface.
- TCP.
- Incoming segments/s. The number of TCP segments received per second.
- Segments completely duplicated/s. The number of duplicated segments received per second. A segment is duplicated when it is received many times after one or more retransmissions.
- % Segments duplicated. Percentage of duplicated segments received (% Segments duplicated = Segments completely duplicated / Incoming segments * 100).
- Outgoing segments/s. The number of TCP segments transmitted per second.
- Segments retransmitted/s. The number of TCP segments retransmitted per second.
- % Segments retransmitted. Percentage of retransmitted segments (% Segments retransmitted = Segments retransmitted / Outgoing segments *100).
- Retransmit timeouts. The number of timeout triggers for segment retransmissions.