Linux
Supported versions
The Linux monitor has been tested on CentOS, Debian, Fedora, Mandriva, Red Hat, Suse and Ubuntu operating systems.
Connection settings
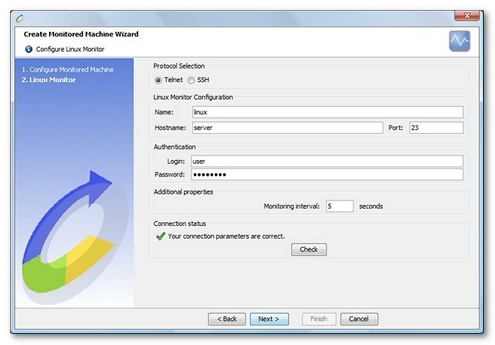
When creating a Linux monitor, the protocol must be specified (Telnet or SSH).
Defining a Linux connection to a server requires the name or IP address of the machine to be monitored, as well as the connection port. The standard access ports are port 23 for the Telnet protocol and port 22 for the SSH protocol.
A valid user account also must be entered to allow NeoLoad to connect to the server and retrieve the performance counters to be monitored. NeoLoad can open up to three Telnet/SSH connections to the server, depending on the counters to be monitored.
- Warning: With some configurations, repeated connections to the server using the same account (e.g. root account) may not be possible. If this is the case, and depending on the selected counters, certain counters may not function.
Specificities of the SSH protocol
NeoLoad supports the following authentication methods:
- Login/Password with the fields:
- Login with the user login which allows all the operations onto the server.
- Password with the password which authenticates the user to the server.
- Private key with the fields:
- Login with the user login which allows and authenticates all the operations onto the server.
- Private key with the certificate to specify with a click on the selection button.
- Passphrase with the password to access the certificate.
On certain systems, the authentication must be configured in the SSH configuration file. If the connection parameters are correct, and the authentication fails, check the SSH configuration in the file /etc/ssh/sshd_config. Check to make sure that one of the following parameters has the value yes: PasswordAuthentication, PubkeyAuthentication or PAMAuthenticationViaKbdInt. The SSH service needs to be restarted for any change to take effect.
NeoLoad also supports the following encryption algorithms (ciphers): aes128-cbc, aes128-ctr, aes192-cbc, aes256-cbc, 3des-cbc, 3des-ctr, blowfish-cbc, arcfour, arcfour128, twofish-cbc, twofish128-cbc, twofish192-cbc, twofish256-cbc, and cast128-cbc.
- Warning: The use of encryption algorithms in certain states may be subject to restrictions.
Lastly, NeoLoad supports the following message authentication codes (MAC): hmac-sha1, hmac-sha1-96, hmac-md5, and hmac-md5-96.
Create a Linux monitor
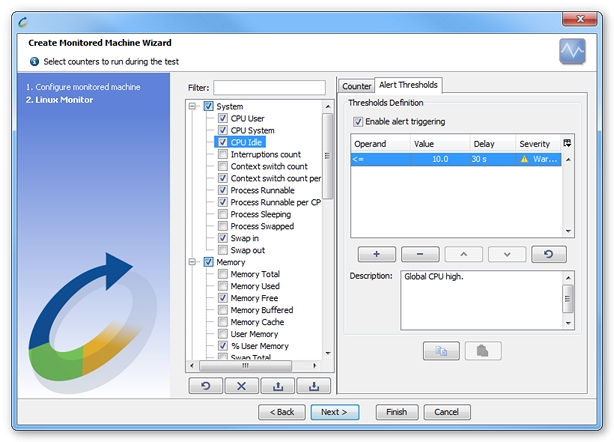
NeoLoad makes it possible to create a new monitor either using the monitored machine creation wizard, as described in Create and configure a monitored machine, or from an existing monitored machine, as described in Create and configure a monitor.

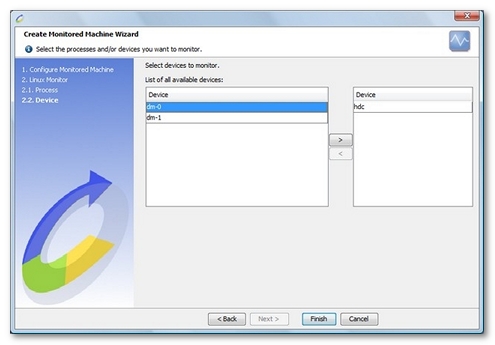
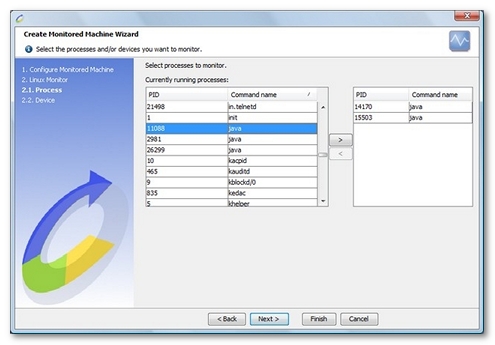
Depending on the type of counter selected, NeoLoad displays additional steps to select the hard disks (Disk (per device) category counter) and processes (Process (per process) category counter) to be monitored.


Available counters

The counters available on Linux operating system are listed here.
- System.
- CPU User. Time spent running non-kernel code (user time, including nice time). Percentage of total CPU time.
- CPU System. Time spent running kernel code (system time). Percentage of total CPU time.
- CPU Idle. Time spent idle. Prior to Linux 2.5.41, this includes IO-wait time. Percentage of total CPU time.
- Interruptions Count. The number of interrupts per second, including the clock.
- Context Switch Count. The number of context switches per second.
- Context Switch Count per CPU. Number of context switches per second per CPU.
- Processes Runnable. The number of processes waiting for run time.
- Processes Runnable per CPU. The number of processes waiting for run time per CPU.
- Processes Sleeping. The number of processes in uninterruptible sleep.
- Processes Swapped. The number of processes swapped out but otherwise runnable. This field is calculated; however, Linux never desperation swaps.
Warning: This field is not accessible on all Linux operating systems (w field in the procs section of the vmstat command).
- CPU wait.
- Swap in. Amount of memory swapped in from disk (/s)
- Swap out. Amount of memory swapped to disk (/s)
- Memory.
- Total Memory. Total usable ram (i.e. physical ram minus a few reserved bits and the kernel binary code)
- Memory Used. Total memory - Memory free.
- Memory Free. Is sum of LowFree+HighFree (overall stat).
- Memory Buffered. Memory in buffer cache. Mostly useless as metric nowadays.
- Memory Cache. Memory in the pagecache (diskcache) minus SwapCache.
- User Memory. Memory used, except caches and buffers. (User Memory = Memory Total - Memory Free - Memory Buffered - Memory Cache)
- % User Memory. Percentage of used memory (% User Memory = User Memory / Memory Total * 100)
- Total Swap. Total amount of physical swap memory.
- Swap Free. Total amount of swap memory free.
- Swap Used. Swap Total - Swap Free.
- Disk (per device). The disk section counters are available per device. Outside the wizard, select the device in the counter definition pane. A device picker is available using the Fill devices button. All the Disk counters need the iostat command installed on the server system. This command is a part of the sysstat package. Please make sure that this command is available before using those counters.
- Disk Read Request Merged. The number of read requests merged per second issued to the device.
- Disk Write Request Merged. The number of write requests merged per second issued to the device.
- Disk Read. The number of read requests issued to the device per second.
- Disk Write. The number of write requests issued to the device per second.
- Disk Read (sector). The number of sectors read from the device per second.
- Disk Write (sector). The number of sectors written to the device per second.
- Disk Read (KB). The number of kilobytes read from the device per second.
- Disk Write (KB). The number of kilobytes written to the device per second.
- Disk Request Size. The average size (in sectors) of the requests issued to the device.
- Queue Length. The average queue length of the requests issued to the device.
- IO Wait. The average time (in milliseconds) for I/O requests issued to the device to be served. This includes the time spent by requests in a queue and the time spent servicing them.
- Disk Service Time. The average service time (in milliseconds) for I/O requests issued to the device.
- IO CPU Time. Percentage of CPU time during which I/O requests are issued to the device (bandwidth utilization for the device). Device saturation occurs when this value is close to 100%.
- Processes (per process). The processes section counters are available per process. Outside the wizard, select the process identifier in the counter definition pane. A process identifier picker is available using the selection button.
- Process Memory Usage. Resident size (kb). The non-swapped physical memory a task has used.
- Process CPU Time. The task share of the elapsed CPU time since the last update, expressed as a percentage of total CPU time.
- Network (per interface). The network section counters are available per interface. Outside the wizard, select the interface name in the counter definition pane. A network interface picker is available through the Populate button.
- Incoming bytes/s. The number of bytes received by the network interface per second.
- Incoming packets/s. The number of packets received by the network interface per second.
- Incoming packet errors/s. The number of broken packets received by the network interface per second.
- Incoming packets dropped/s. The number of packets received and discarded by the network interface per second.
- % Incoming packet errors. Percentage of broken packets received by the network interface (% Incoming packet errors = Incoming packet errors / Incoming packets *100).
- Outgoing bytes/s. The number of bytes issued by the network interface per second.
- Outgoing packets/s. The number of packets issued by the network interface per second.
- Outgoing packets errors/s. The number of broken packets issued by the network interface per second.
- Outgoing packets dropped/s. The number of packets issued by the network interface and lost per second.
- % Outgoing packet errors. Percentage of packets issued by the network interface and considered broken (% Outgoing packet errors = Outgoing packet errors / Outgoing packets *100).
- Packet collisions. The number of packet collisions discovered by the network interface.
- TCP.
- Incoming segments/s. The number of TCP segments received per second.
- Outgoing segments/s. The number of TCP segments transmitted per second.
- Segments retransmitted/s. The number of TCP segments retransmitted per second.
- % Segments retransmitted. Percentage of retransmitted segments (% Segments retransmitted = Segments retransmitted / Outgoing segments *100).