Load Balancer Graphical server monitor
We can use the server monitor on the GUI to graphically view the load being distributed among the servers. It is available per port and per server. If you right-click a desired port or a specific server, you can select the Monitor option.
The Monitor tool provides the same information that you can view in the Manager report, but it dynamically updates the data and shows it in a chart.
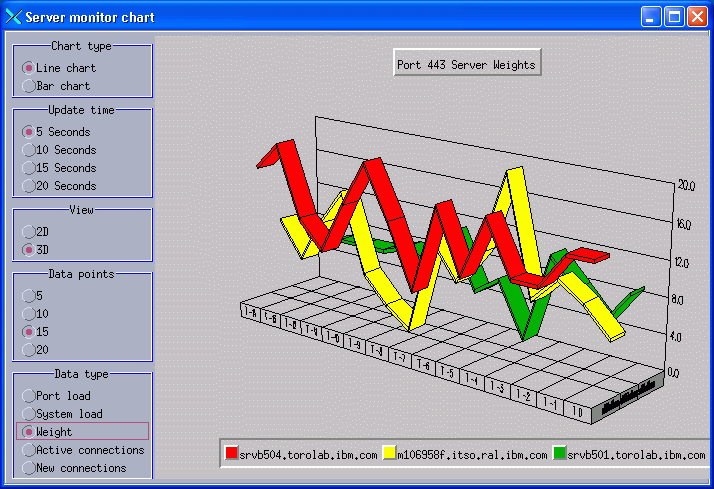
If you choose to monitor a port, there will be one bar or line for each server configured on that port. If you choose to monitor a specific server then there will be only one bar or line for the chosen server. By default, the chart presents the weight of the servers.
Figure 19-1 shows a snapshot of the server weights for our NAT forwarding scenario, with the Load Balancer and two Web servers, srvb501 and srvb504, on the same subnet Toronto, and one Web server, m106958f, in Raleigh, while running a Borland SilkPerformer test script simulating five concurrent clients, making an HTTPS request every five seconds. You can also select Port load (the load value provided by the advisor), System load (the load value provided by the metric server), Active connections, and New connections.

Figure 19-1 Monitor tool
In order to monitor the behavior of the cluster, you can try repeatedly selecting a clustered page using the browser, or you can use an HTTP benchmarking tool to send requests to the cluster. In order to monitor the behavior of the cluster, you can try repeatedly selecting a clustered page using the browser, or you can use an HTTP benchmarking tool to send requests to the cluster. In our lab, we used Borland SilkPerformer.
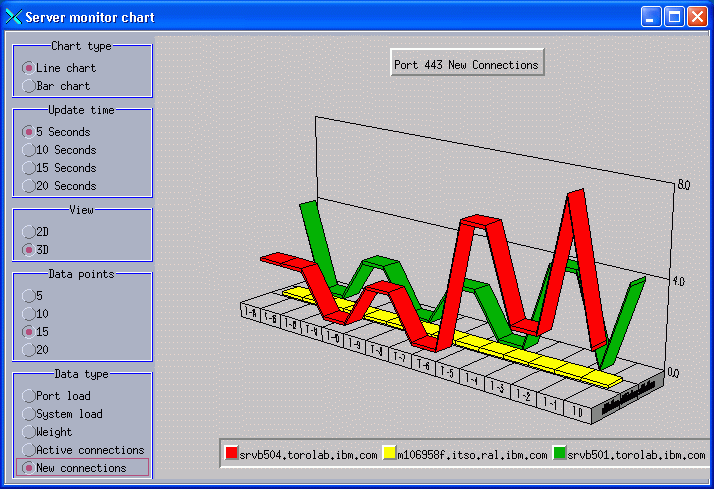
Using the Monitor tool, we can see the distribution of the load by selecting New connections in the Data Type box. This is shown in Figure 19-2 for a case in which one of the servers (or the network between Toronto and Raleigh) is experiencing problems, not accepting any new connections.

Figure 19-2 Load distributions (new connections) with one server down
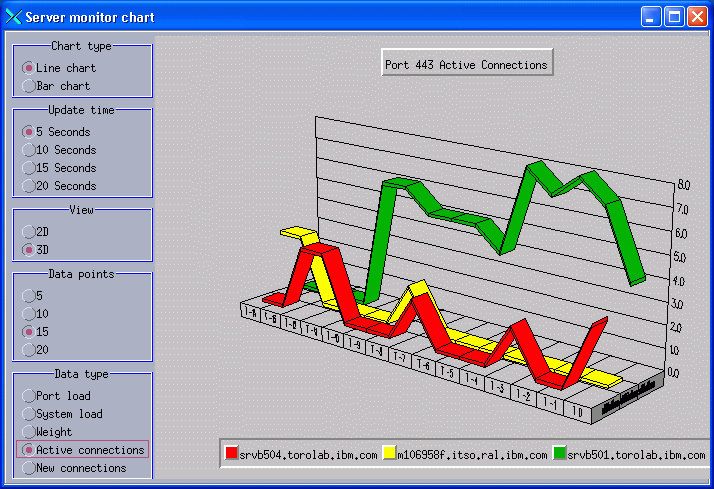
Looking at the current number of active connections by selecting Active connections, as shown in Figure 19-3, we can see that the active connections of m106958f (the Raleigh machine) have timed out.

Figure 19-3 Active connections
The information about the Raleigh server being down is also available in port info of the dscontrol manager report output, as shown in Example 19-3.
Example 19-3 Manager report - failure of m106958f server
-------------------------------------------------------------------
| nat1.torolab.ibm.com |
| 9.26.52.154 | WEIGHT | ACTV | NEWC | PORT | SYS |
| PORT: 80 |NOW NEW| 49% | 50% | 1% | 0% |
-------------------------------------------------------------------
| srvb504.torolab.ibm.com |
| | 9 9 | 3 | 2 | 20 | 0 |
| m106958f.itso.ral.ibm.com |
| | 0 0 | 0 | 0 | -1 | 0 |
| srvb501.torolab.ibm.com |
| | 10 10 | 4 | 4 | 22 | 0 |
-------------------------------------------------------------------

Note that the PORT column shows the value -1 for the m106958f server. This means that the advisor is getting no response from this server. That makes the weight of this server set to zero (see column WEIGHT).
| xxxx |
