Intelligent management
Overview
Intelligent Management is the integration of WebSphere Virtual Enterprise into WAS ND V8.5. The Intelligent Management functionality includes the following key features:
- Intelligent routing improves the quality of service by ensuring that priority is given to business critical applications and users.
Requests to applications are prioritized and routed based on administrator-defined rules.
- Health management provides the ability for you to specify conditions to be automatically detected and take corrective actions when these conditions are observed.
- Application edition management provides the ability to roll out new versions of applications without experiencing downtime for a maintenance window.
Using this feature, we can validate a new edition of an application in the production environment without affecting users and upgrade the applications without incurring outages to the users. We can also run multiple editions of a single application concurrently, directing different users to different editions.
- Performance management provides a self-optimizing middleware infrastructure.
By using dynamic clusters we can automatically scale up or down the number of running instances of a cluster to meet the defined service policies. We can take advantage of an overload protection to limit the workload of a server instance, and prevent heap exhaustion, CPU exhaustion, or both from occurring.
These capabilities are referred to as dynamic operations, which is the core functionality that provides application infrastructure virtualization.
The Intelligent Management functionality also provides support for a range of middleware servers. Middleware servers encompass all servers in the middleware tier that provide the infrastructure for applications or their data.
Middleware server support includes the following servers:
- Apache HTTP Server
- Apache Geronimo Server
- WAS Community Edition
- External Java application servers
Key elements...
- On Demand Router (ODR)
The ODR is an intelligent proxy and workload manager that acts as the entry point for traffic coming into a Websphere Application Server ND V8.5 cell with an Intelligent Management topology. The ODR performs request prioritization, flow control, and dynamic workload management, for HTTP requests and SOAP over HTTP requests.
- Autonomic managers
Autonomic managers make decisions for the environment, including application management, traffic shaping, and health placement. The autonomic managers include the following components:
- Application placement controller (APC)
- Dynamic workload manager (DWLM)
- Autonomic request flow manager (ARFM)
- Health controller
- Dynamic clusters
A dynamic cluster is a server cluster that enables application server virtualization. Members of a dynamic cluster are:
- Automatically created based on a membership policy
- Automatically updated using a server template
- Automatically started and stopped based on current demand, available resources, and service policies
This allows the application environment to dynamically expand and contract depending on the amount of workload that needs to be handled at any given time.
The APC controls the operation of the dynamic clusters. Each node within a dynamic cluster has an instance of an application server running that cluster�s applications, which can be started dynamically as traffic for that application increases.
- Operational policies
An operational policy is a business or performance objective that supports specific goals for specific requests. Operational policies include service and health policies.
- Service policies specify performance goals for applications
- Health policies specify what constitutes server's sickness and the appropriate actions to take when a sick server is detected
- Traffic shaping
Traffic shaping is the process of classifying incoming requests based on policies and managing the distribution of requests among application servers.
Traffic shaping is done at different entry points, depending on the type of request. For HTTP, SOAP, and Session Initiation Protocol (SIP) requests, traffic shaping occurs in the ODR. For Internet Inter-ORB Protocol (IIOP) and JMS requests, traffic shaping occurs at the application server.
Autonomic managers play a key role in traffic shaping. They perform the classification and prioritization of requests and manage the environment to balance the workload.
- Health management
The health monitoring and management subsystem continuously monitors the operation of servers against user-defined health policies to detect functional degradation related to user application or server malfunctions.
- Runtime operation monitoring
The visualization components of WAS V8.5 enhance the dmgr console to provide live data on the performance and health characteristics of the entire cell.
- Application edition management Loss of service to users means loss of business to you. The application edition management feature ensures the users of the application experience no loss of service when you install an application update.
Sample topology
For the purpose of how to create and configure the different components involved in a WAS ND V8.5 with Intelligent Management

The sample topology used is appropriate for non-production environments. While it contains the functionality of a WAS ND V8.5 with Intelligent Management functions, it does not have the security, fault tolerance, or scalability capabilities of a production topology. With this topology, we can test the basic workload management behavior for an application.
Configure dynamic operations
The dynamic operations environment consists of autonomic managers whose purpose is to maximize utilization using defined business goals. Dynamic operations allow an application environment to scale as required by the virtualization of WebSphere resources and the use of a goals-directed infrastructure. Therefore, we can increase the speed at which the environment adapts to the business requirements.
Using the dynamic operations features of WAS we can change the way a typical WebSphere environment is configured to one that has the following features:
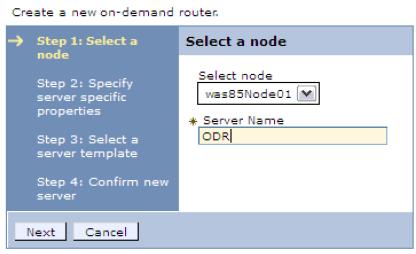
Create ODRs
To create an ODR in a WAS ND V8.5 cell...
- Click...
-
Servers | Server Types | On Demand Routers | New
- Select the node where the ODR will run, and enter a name for the ODR.
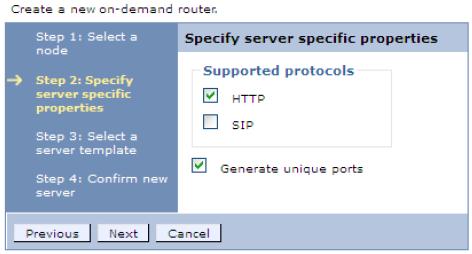
- Specify the protocols the new ODR will handle. In this example, we use the HTTP protocol. Clear the check box for the SIP protocol, and click Next.
- Select the ODR server template, and click Next.
- Review the summary and then click Finish. Save the changes to the master repository.
The new ODR is now created.
Service policies
Work classes categorize and prioritize work requests and service policies. A service policy consists of a user-defined performance goal and, in some cases, an importance level. Service policies are related to work requests through transaction classes. There are three types of performance goals in WAS ND V8.5:- Discretionary
This goal type indicates work that does not have significant value. Requests are processed when no higher request is waiting. As a result, work of this type can see a degradation in performance when resources are constrained. This is the default service goal.
- Average response time
This goal type allows you to specify the average response time goal in milliseconds or seconds. The system attempts to achieve this goal at a target percentage of 90% by default.
- Percentile response time
This goal type allows you to specify both the average response time goal and the target percentage, for example, 95% of all requests must be answered in less than 1000 milliseconds. This performance goal type is useful for applications that have application response times that occasionally deviate from the norm and can skew the average response time.
Administrators can specify the relative level of importance of a service policy. A request associated with a service policy of higher importance is given priority over a request associated with a service policy of lower importance. This guarantees that if performance goals for all service policies cannot be met due to prolonged intense overload to the environment, WAS can use the level of importance to decide which service policy takes priority. The following seven levels of importance can be set:
- Highest
- Higher
- High
- Medium
- Low
- Lower
- Lowest
Planning is essential to select the correct importance value that makes sense to the business requirements. One approach is to leave the majority of the applications with a discretionary goal, assign a higher goal to the important applications using service policies, and use the highest importance levels only if you need to further differentiation between the higher goal applications.
Work classes
A work class is the grouping of work to be done by an application server. WAS determines how to handle the work class through a set of rules that each work class contains.
For most requests, work classes are used to map incoming requests to transaction classes.
As requests enter the On Demand Router (ODR), they are mapped to a work class, they are then mapped to a transaction class depending on the classification rules and by extension to a service policy. For generic server clusters and for SIP, work classes are not used. The rules for classifying requests to transaction classes are configured on the ODRs.
There are two main types of work classes:
- Service policy work classes
Work class rules associate incoming work with a service policy, thus indicating to WAS when to forward the work to the application server.
- Routing work classes
Work class rules associate incoming work with a routing policy, thus indicating to WAS where to send the work. HTTP requests and SIP messages are also associated with a single routing work class. Routing work classes do not exist for IIOP and JMS because these protocols do not flow through the ODR, so no routing policy is needed.
Work classes combined with classification rules allow the Autonomic Request Flow Manager (ARFM) to prioritize a request. For example, the /shop/checkout URI can get more resources than the /shop/info URI because checkout takes more time or because the business considers checkout higher importance.
There are four possible types of work classes based on the supported protocols in the application:
- HTTP work classes
- SOAP work classes
- IIOP work classes
- JMS work classes
For applications that run on platforms other than WAS, only work classes based on the HTTP protocol are supported.
Work class requests classification rules
Work class requests can be classified by rules. The syntax and semantics of a boolean expression for a rule are similar to the WHERE clause of a structured query language (SQL) expression. We can combine the expressions with operators. WAS provides a subexpression builder to help define these rules. Classification rules can be based on different information from the request, including...
- client ip
- user ID
- roles
- request query parameter
- request header
- HTTP method
Transaction classes
Transaction classes provide the link between applications and service policies. The service policy creates the goal, while the transaction and work classes are used to map requests to that goal. Transaction classes are defined in service policies. The relationship between service policies and transaction classes is one to many. A single service policy can have multiple transaction class definitions, but each transaction class belongs to exactly one service policy.
Transaction classes are a subcontainer of the service policy for work being classified into the service policy that can be used for finer-grained monitoring. They can also be used as a mechanism to group cross application work together for common monitoring.
Every service policy has a default transaction class, which in most scenarios is sufficient. Additional transaction classes are created when finer-grained monitoring is necessary for the environment. Each transaction class name must be unique within the cell.
Each work request belongs to exactly one transaction class, and each transaction class belongs to exactly one service policy.
Shows the relationship between service policies, work classes, and transaction classes. The uniform resource identifiers (URI) are grouped together in work classes. When a request for a specific URI arrives, the URI is checked against the classification rules. Based on the rules, different transaction classes are addressed. These transaction classes are uniquely assigned to a service policy. The request is processed based on the service policy. A request filter in the ODR handles these steps and classifies the incoming requests into the associated service policies.

Create service policies
- In the dmgr console, select Operational policies | Service policies and then click New.
- Define the general property values for the service policy (Figure 14-5 on page 528). Enter a name and description for the new service policy, and select a goal type:
� Average response time � Discretionary
� Percentile response time

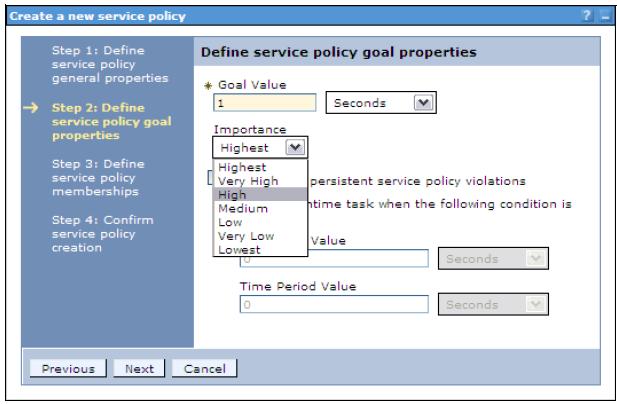
Define the service policy general properties
- Enter a goal value.
- Select the importance level.
- To monitor for persistent service policy violations and have a runtime task created, select the Monitor for persistent violation option, and enter values for the goal delta and time period:
Goal Delta Value This is the allowable amount of time difference between the configured goal value and the actual average response time of requests that are served. Time Period Value This value signifies how long that goal delta value can be violated before it is considered breached and a runtime task is generated.

Save the changes to the master repository. A new service policy is created.
to create more service policies.
To define goal values for service policies, we have to complete the benchmarking for performance phase of the application development cycle. After that, you will know the response time of the applications under normal workloads and can assign a realistic goal value above this time.
Associating service policies with an application
With the service policies and transaction classes created, the next step is to define work classes for each application and associate the work class with the transaction class for the service policy. Work classes are associated with each application. We use the default application (DefaultApplication.ear) that comes with WAS to show the creation of work classes.To associate service policies with an application:
- In the dmgr console, select Applications | Enterprise Applications | application_name and then click the Service Policies tab .
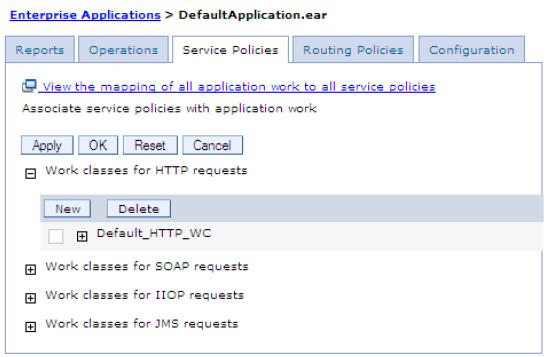
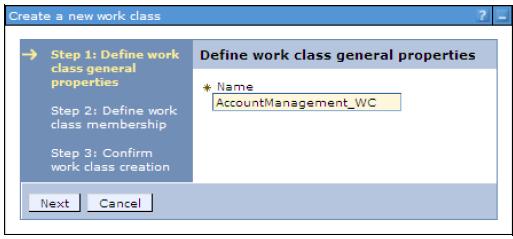
- Click New to define a new work class for HTTP requests.
- Enter a name for the new work class and then click Next (Figure 14-9 on page 531).
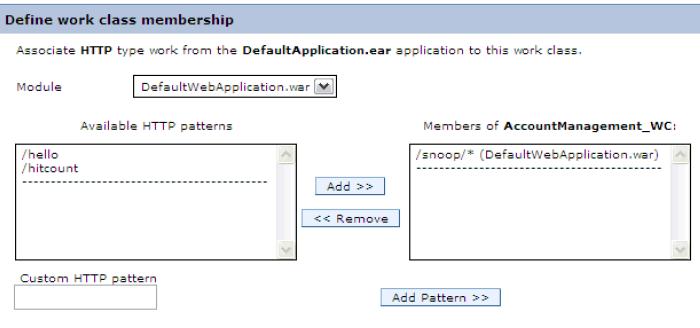
- Define the HTTP patterns that will be mapped to this work class:
- Select the application module.
- Select the HTTP patterns and then click Add.
- Click Next.
Note that we can add custom HTTP patterns using the Add Pattern button.
- Confirm work class creation and then click Finish.
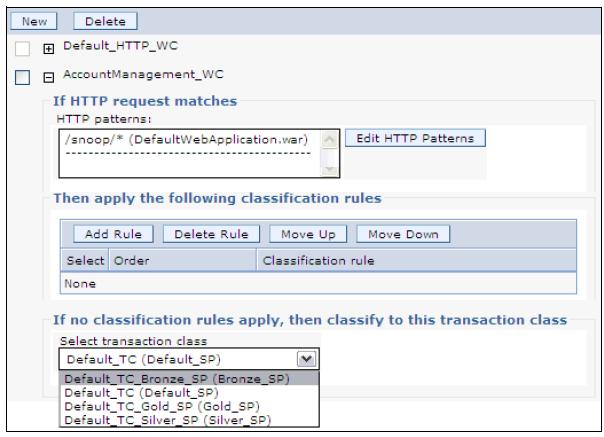
- Select an appropriate transaction class for this work class. We can apply different classification rules to the requests. Click Add Rule to configure additional classification rules
- Repeat steps 2-6 to map another URI pattern to a service policy.
- Click OK, and save the configuration.
If we click the link View the mapping of all application work to all service policies in the Service Policies tab (Figure 14-8 on page 530), we can see all the mappings defined for the application.
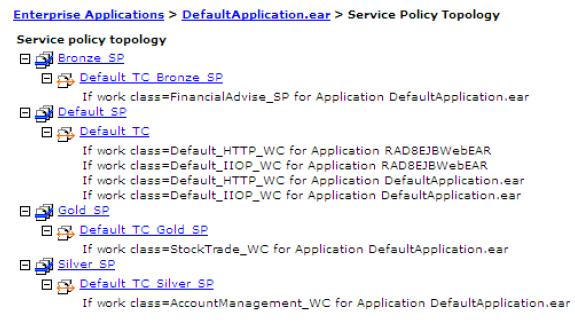
We can also see the mappings of service policies for all applications in the menu option by clicking Operational policies | Service policy topology.
Configure health management
The health management subsystem provided with WAS ND V8.5 allows you to take a policy-driven approach to monitoring the application server environment and to define actions to be taken when certain criteria is discovered.
The health management subsystem consists of two main elements:
- Health policies define specific health criteria that can indicate a problem:
- Where to monitor for this problem
- The action to take
- Whether the action is done automatically or by an operator
- Where to monitor for this problem
- A health controller monitors the WAS environment for conditions
defined by the health policies and performs the appropriate actions.
Use health monitoring carefully, and only define and assign to servers if you think a particular health policy is needed. Health monitoring can make the environment more reliable, but it can also have performance impacts on the environment. Understanding the environment, including its capacity, usage, and loads will help you plan your policies.
Health monitoring is not meant to replace the testing and benchmarking phases of the application development lifecycle. The recommendation is that you test and benchmark for performance every application prior to being deployed in a WAS environment.
Health conditions
Health conditions define the variables to monitor. Several categories of health policy conditions exist. Choose from the following predefined health conditions:- Age-based condition
Tracks the amount of time the server is running. If the amount of time exceeds the defined threshold, the health actions run.
- Excessive request timeout condition
Specifies a percentage of HTTP requests that can time out. When the percentage of requests exceeds the defined value, the health actions run. The timeout value depends on the environment configuration.
- Excessive response time condition
Tracks the amount of time that requests take to complete. If the time exceeds the defined response time threshold, the health actions run.
- Memory condition: Excessive memory usage
Tracks the memory usage for a member. When the memory usage exceeds a percentage of the heap size for a specified time, health actions run to correct this situation.
- Memory condition: Memory leak Tracks consistent downward trends in free memory available to a server in the Java heap. When the Java heap approaches the maximum configured size, we can perform either heap dumps or server restarts.
- Storm drain condition
Tracks requests that have a significantly decreased response time. This policy relies on change point detection on given time series data.
- Workload condition
Specifies a number of requests that are serviced before policy members restart to clean out memory and cache data.
- Garbage page percentage condition
Monitors a JVM or set of JVMs to determine whether they spend more than a defined percentage of time in garbage page during a specified time period.
We can define custom conditions for the health policy if the predefined health conditions do not fit your needs. You define custom conditions as a subexpression tested against metrics. When you define a custom condition, consider the cost of collecting the data, analyzing the data, and if needed, enforcing the health policy. This cost can increase depending on the amount of traffic and the number of servers in your network. Analyze the performance of your custom health conditions before you use them in production.
Enabling and disabling health management
Health management is enabled by default. Use health management to protect the system from user application malfunctions, including memory leaks and application hangs. Health management uses health policies to define a set of conditions. Intelligent Management uses the health conditions to monitor the health of the system.To enable or disable the health management:
- In the dmgr console, click Operational policies | Autonomic managers | Health controller

- Enable or disable health monitoring.
When the check box is selected, the health condition of the environment is monitored. When the check box is not selected, health monitoring is disabled.
Health policy actions
There are different actions that are performed if a policy breach is detected. The possible actions that can be included into an action plan are:
- Restarting the application server
When a server is a member of a dynamic cluster, another instance of the dynamic cluster is started to serve user requests before the server that triggered the policy breach is shutdown. This allows WAS to handle potential problems with the least amount of impact to its consumers.
- Taking a thread dump (javacore)
The option to take thread dumps is only supported for application servers running in IBM JVMs.
- Taking JVM heap dumps on IBM Java Development Kit (JDK)
This option works for IBM JVMs only.
- Put server into maintenance mode
Maintenance mode is used to perform diagnostics, maintenance, or tuning on a node or server without disrupting incoming traffic. Putting a server into maintenance mode allows the remaining requests on the server to be processed.
Any requests that have an open session on the server are routed to the server until the session ends or times out. After all requests are completed, the server is moved to maintenance mode. Any new requests are routed to servers that are not in maintenance mode.
- Put server into maintenance mode, and break affinity
The HTTP and SIP session affinity is broken, and the session is moved to another server running in normal mode.
- Take server out of maintenance mode
After the server reaches a healthy state, it can be reinstated to serve requests. For example, if a server exceeds a memory threshold, putting the server in maintenance mode gives the server a chance to recover through garbage page while no new requests are being sent to it. After heap utilization is below the threshold, the server can be taken out of maintenance mode.
- Custom action
With a custom action, you define a Java or non-Java executable file to define corrective actions to run when a health condition is broken.
Reaction mode
The health management subsystem functions in reaction mode, defined by the level of user-interaction when the health condition determines corrective action is needed. There are two possible reaction modes:
- Automatic mode
When the reaction mode on the policy is set to automatic, the health management system takes action when a health policy violation is detected. The logging data and the defined reaction are performed automatically.
- Supervised mode
The health management system creates a runtime task that proposes one or more reactions. The system administrator can approve or deny the proposed actions. The recommendations on actions are sent to the administrator. If the administrator follows the recommendations, the only action required is selecting a button, and the actions are performed. This option is widely preferred by the administrators who are not yet comfortable with giving to WAS with Intelligent Management total control in performing autonomic actions.
Create health policies
A health policy is the definition of specific health criteria you want WebSphere Application Server to protect against. The health management function uses the defined policy to search the environment for software malfunctions.
To define a health policy using the dmgr console:
- Select Operational policies | Health policies and then click New.
- Enter a name for the health policy and the health condition that will trigger the actions,
.

- Depending on the health condition selected, enter the health condition general properties.
Select the reaction mode, and configure the actions to be taken

- Select the members to monitor with this health policy. Specify the filter by option, click the member to add, and click Add.

- Review the summary and then click Finish.
Save the changes to the master repository.
If the reaction mode of the health policy is set to supervised, and the health condition is breached, you will get a runtime task. To review the Runtime tasks, select System administration | Task Management | Runtime Tasks,.
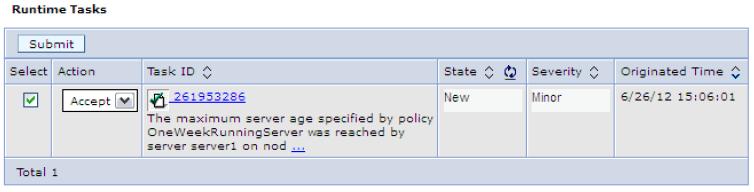
To accept the runtime task and run the action plan for the health policy, select the task, select the Accept action and then click Submit.