Profiler configuration for WebSphere Studio test environment
To profile an application in IBM WebSphere Studio Application Developer V5.1.1, the server in the test environment should have been started in profiling mode. From the Server or J2EE Perspective, right-clicking the server displays a menu that includes the profiling option. This is shown in Figure 17-3. As a prerequisite, have previously deployed the application to the server and configured any server resources required. We suggest that you perform some basic testing of the application in IBM WebSphere Studio Application Developer prior to using the profiling tools, to ensure that the application is operating correctly.
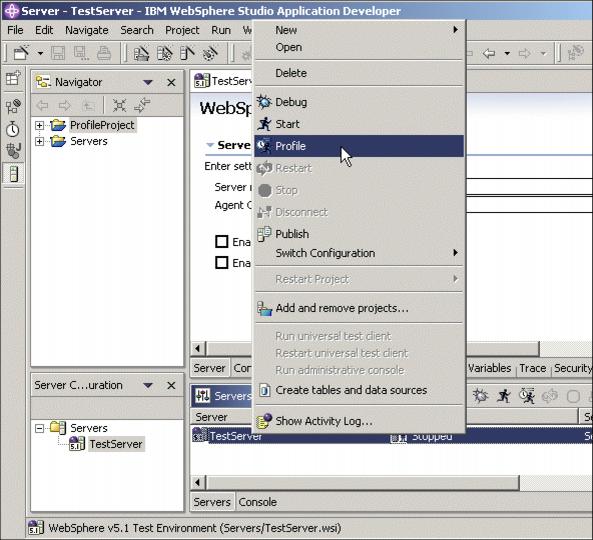
Figure 17-3 Starting a server in profiling mode
Once the server has been started, go to the Profiling and Logging Perspective. It can be accessed by clicking Open a Perspective -> Profiling and Logging as shown in Figure 17-4.

Figure 17-4 Selecting the Profiling and Logging Perspective
To profile a local application instead of a remote one, select Profile -> Attach -> Java Process.
WebSphere is a trademark of the IBM Corporation in the United States, other countries, or both.
IBM is a trademark of the IBM Corporation in the United States, other countries, or both.