Generic Profiler configuration (local and remote environments)
The remainder of this procedure is the same for both local and remote profiling. A window is displayed to select the Java process to attach to. The process ID is the same as for the WAS instance and it can be found in the .pid file created in the server root, when the server is started.
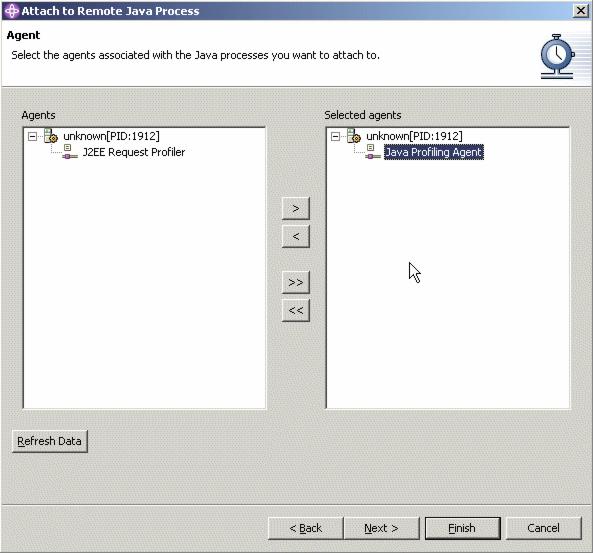
There are two agents available: Java Profiling Agent and J2EE Request Profiler.
1. To obtain detailed information about the runtime behavior of the application, select the Java Profiling Agent option as shown in Figure 17-5. The J2EE Request Profiler will provide higher-level overview data about the application. It is also possible to select both agents from this window.

Figure 17-5 Select the agents associated with the Java processes
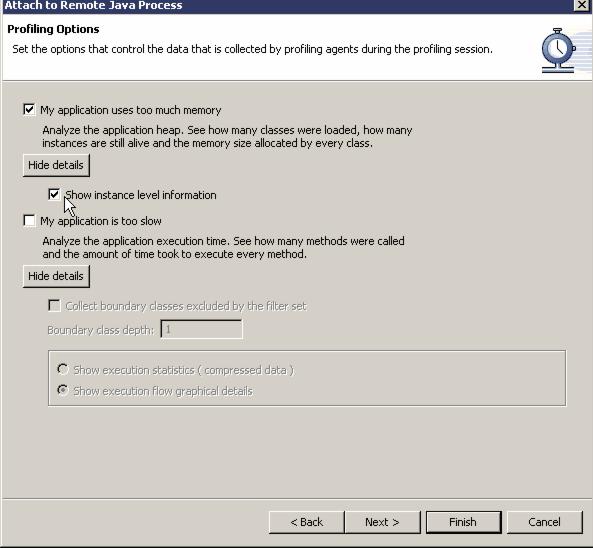
Important: When studying the execution flow of an application, we recommend that the J2EE Request Profiler be used. On the other hand, to obtain a detailed information relating to instance sizes, we suggest using the Java Profiling Agent with Select instance level information checked as shown in Figure 17-8. |
2. Click the Next button to obtain the window for specifying the profiling project and the monitor for saving the profiler data. Usually the default values can be kept.
A feature that has been introduced since WebSphere Studio Application Developer V5.0 is the ability to redirect output to a file. This is especially useful in situations where the information generated from the application being monitored will exceed the amount of memory that WebSphere Studio Application Developer has been allocated or that is available on the system.
3. Click the Next button once again to get to the Profiling Filters window, as displayed in Figure 17-6. This allows you to specify the classes for which profiling information should be gathered.
There are a number of predefined filter sets available. Each of the filter sets specifies a set of rules to apply to determine if methods from particular classes and packages should be excluded or included. When profiling with the WebSphere test environment, we suggest you select the WebSphere J2EE filter as a good starting point, and customize it as required.

Figure 17-6 Profiling Filters
4. New rules can be added by clicking the Add button. This displays the window shown in Figure 17-7. Each filter has three attributes - a package or class name, a method name and a flag to specify if the filter is for inclusion or exclusion of particular data. Wildcards (*) can be used when specifying the package or class and method names. As well as adding new filters, existing filters can be edited or removed, and the ordering of filters changed from the Profiling Filters window. The ordering is important as it specifies the precedence of the filter rules. If a rule for a subpackage differs from the rest of the package, the subpackage rule must appear first in the list. Completely new filter sets can also be created, and existing filter sets can be removed or renamed.

Figure 17-7 Specifying a new filter
When specifying filter sets remember that collecting data about too many classes will slow down the Profiler and can make it more difficult to analyze the results due to the volume of data. Normally the standard Java and WebSphere runtime classes are excluded, as the aim is to profile the application code.
5. Click Next again to display the Profiling Options window as shown in Figure 17-8. It allows specification for whether execution flow information should be captured.
Make sure that the Collect instance-level information check box is selected.
The "Collect boundary classes excluded by the filter" check box allows you to specify whether profiling data should be collected about classes that are not included in the filter list, but that are directly referenced by classes that are in the filter list.

Figure 17-8 Profiling Options
6. Click Next to display the window shown in Figure 17-9 where you can limit the amount of data collected by the Profiler. It allows you to instruct the Profiler to stop profiling after a particular number of method invocations, or after a specified time has elapsed.

Figure 17-9 Limit the amount of data collected
7. Click Finish to complete the procedure for attaching to the (remote) Java process.
WebSphere is a trademark of the IBM Corporation in the United States, other countries, or both.
IBM is a trademark of the IBM Corporation in the United States, other countries, or both.