|
|
| Obtaining a thread dump to analyze
There are several ways to get a Java stack trace (or thread dump) into the Thread Analyzer.
From an existing Java stack trace file
|
| 1.
| Select ThreadDumps -> Open Existing File as shown in Figure 16-23.
|
| 2.
| Select and open the Java stack trace file (normally named javacore*.txt) you wish to analyze. The shortcut to opening an existing file is CTRL-O.
From a server output log file
You can take a Java stack trace source from the appserver's log files, <stderr> or <stdout> files, or any other snippets of files that contain a thread dump as shown in Figure 16-24.
|
| 1.
| Select ThreadDumps -> Obtain from server output.
|
| 2.
| Click Add file(s) on the new pop-up window to select one or more files.
|
| 3.
| Click the Process button to extract the Java stack trace parts from the files.

Figure 16-24 ThreadAnalyzer - Obtain from server output
Obtaining a thread dump in real time
You can also generate a real-time thread dump while the appserver is running:
|
| 1.
| Before getting a thread dump from an appserver, first define the Setup Options. Select ThreadDumps -> Setup Options, as shown in Figure 16-25.
|
|
a.
In the pop-up window, enter the WAS installation directory if it is not the one displayed as "Current WAS Home".
|
|
b.
Type in the name of the appserver you want to analyze if it is not the Current Application Server Name.
|
|
c.
Verify or select the SOAP port number. You should first check this port number from the WebSphere Administrative Console by selecting Servers -> Application Servers in the console navigation tree. Open the server configuration and select End Points from the Additional Properties pane. The port number is found in the SOAP_CONNECTOR_ADDRESS configuration.
|
|
d.
Change or take the default for the wait time, stack trace saving options, and log options.
|
|
e.
Now, you can generate a thread dump from a running appserver by clicking the OK button.
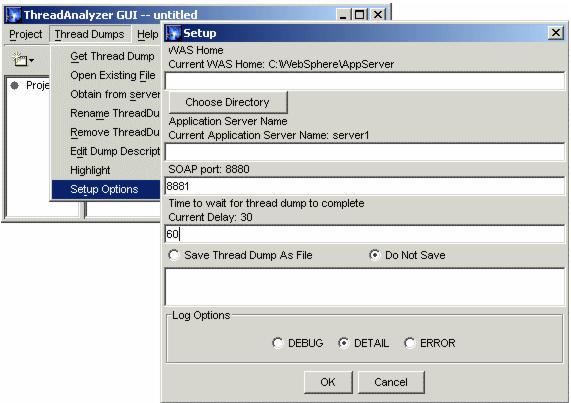
Figure 16-25 ThreadAnalyzer - Setup Options
|
| 2.
| After you have defined the Setup Options, click ThreadDumps -> Get ThreadDump as shown in Figure 16-26 or simply press Ctrl+G.

Figure 16-26 ThreadAnalyzer - Getting ThreadDump
|
|
Prev | Home | Next
WebSphere is a trademark of the IBM Corporation in the United States, other countries, or both. IBM is a trademark of the IBM Corporation in the United States, other countries, or both. |