|
|
| Navigating in ThreadAnalyzer
If you have successfully generated or loading the Java stack trace or thread dump see something like in Figure 16-27.
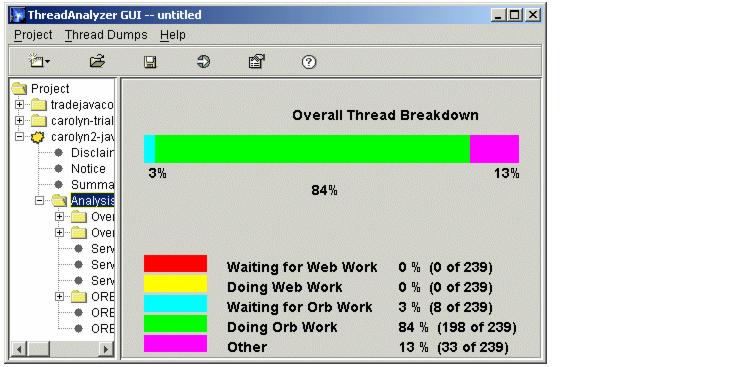
Figure 16-27 ThreadAnalyzer -- Result of ThreadDump
There are several views available that you can use for your analysis.
|
|
| Overall thread analysis: This view is the overall thread analysis. If threads exist in the thread dump, they will be listed here.
|
|
| Overall monitor analysis: This view shows the overall monitor analysis and Interpreting Deadlock Results as shown in Figure 16-29. Expand this tree node to see a list of all monitors in this thread dump.
|
|
| You can see that there are no servlet engine worker threads waiting or doing anything. However, you will note that the ORB has eight threads waiting for work and 198 threads doing work. For more detailed information about what the threads are doing, you can use the overall thread analysis for all threads state in the left navigation tree, as shown in the figure as shown in Figure 16-28. With this picture, you would have a strong supposition of a problem occurring in the ORB.
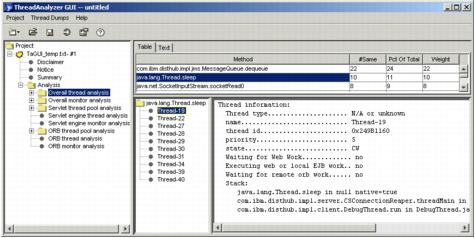
Figure 16-28 ThreadAnalyzer - Overall thread analysis
|
|
Prev | Home | Next
WebSphere is a trademark of the IBM Corporation in the United States, other countries, or both. IBM is a trademark of the IBM Corporation in the United States, other countries, or both. |