Enabling JVMPI from the Administrative Console
To enable JVMPI reporting for each individual appserver or Node Agent, do the following in the WebSphere Administrative Console:
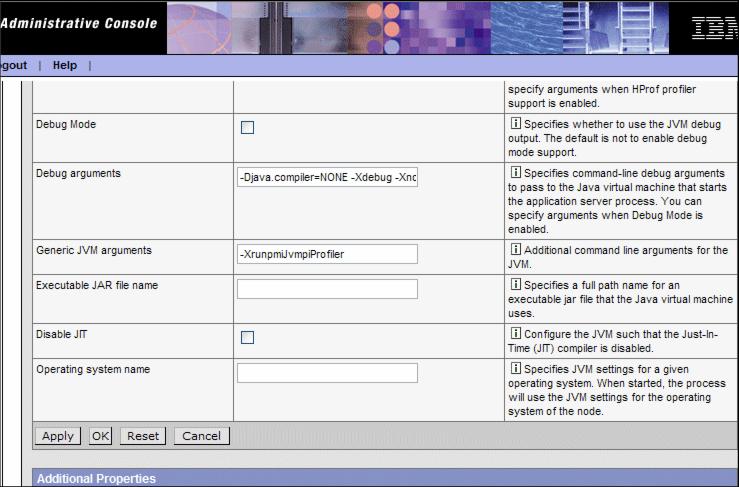
Figure 16-6 Enabling JVMPI
Make sure you have set the instrumentation level in the PMI setting on the JVM module to MAX for the profiler counters to be updated. Also, refresh the Tivoli Performance Viewer if you are using it.
Important: Node Agents and appservers collect data in the JVMPI counters of the JVM module regardless of having the command-line argument specified. Be aware that collected data is not reliable until the -XrunpmiJvmpiProfiler argument is specified. |
WebSphere is a trademark of the IBM Corporation in the United States, other countries, or both.
IBM is a trademark of the IBM Corporation in the United States, other countries, or both.
Tivoli is a trademark of the IBM Corporation in the United States, other countries, or both.