IBM BPM, V8.0.1, All platforms > Authoring services in Integration Designer > Troubleshooting > Use the integration debugger for problem determination
Integration debugger
In IBM Integration Designer, the integration debugger is the designated tool for debugging business integration components. The integration debugger features a sophisticated user interface that enables you to easily and precisely perform component debugging.
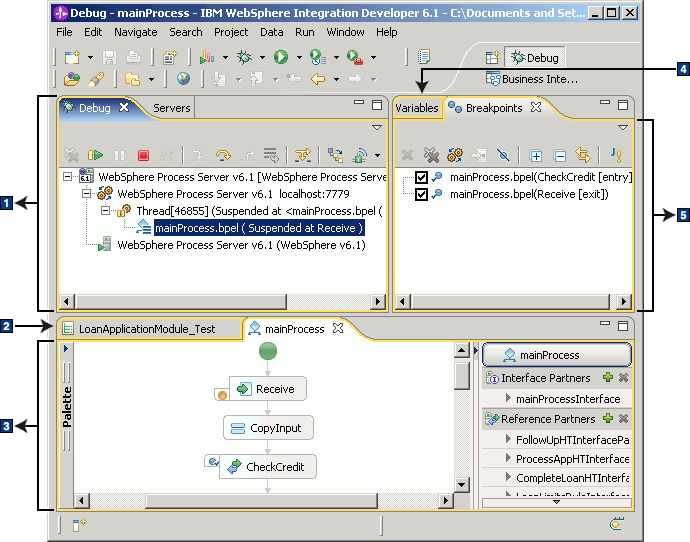
The integration debugger is primarily controlled from the Debug perspective, which is shown in the following figure:

In the Debug perspective, there are five major features that are typically used by the integration debugger. These features are listed in the following table.
| Feature | Description |
|---|---|
| 1 | Debug view |
| 2 | Integration test client |
| 3 | Component editors |
| 4 | Variables view |
| 5 | Breakpoints view |
These five features consist of an intuitive and flexible user interface for the integration debugger and are described individually in the following topics.
Restriction: Monitor Debugger does not support using special XML characters like ', ", <,> ,& in file name of event definition *.xsd *.cbe, and the monitor model element's ID.
- Integration test client
The integration test client is an IBM Integration Designer tool that you can use to test your modules and components. You can also use the test client to automatically start the integration debugger and create a running instance of your component that you can debug. - Component editors and the integration debugger
The component editors are IBM Integration Designer tools used to create business integration components, such as business processes or mediation flows. In the component editors, you can set breakpoints on component elements or source code and then use the integration debugger to graphically step through instances of the components and work with their variables or messages. - Breakpoints view in the integration debugger
The Breakpoints view displays the breakpoints that are set on component elements and source code in all components. In the Breakpoints view, you can remove, disable, or enable breakpoints. If you are working with business processes, you can also apply hit counts to breakpoints and restrict breakpoints to specific process threads. - Debug view in the integration debugger
In the integration debugger, you use the Debug view to control the processing of component instances and alter their state at run time. When you start your server in Debug mode and then create and start one or more component instances, the Debug view is populated with component-related entities, such as component threads and stack frames. - Variables view in the integration debugger
The Variables view displays all variables, messages, and associated values for the stack frame selected in the Debug view.For example, for business processes, the Variables view displays process variables, partner variables, and correlation set variables. And for mediation flows, the Variables view displays messages.
- Icons and symbols for the integration debugger
In the integration debugger and other IBM Integration Designer tools, icons are images used to invoke actions. Symbols, by comparison, are images that simply represent workbench elements and they are not used to invoke actions. - Keyboard shortcuts for the integration debugger
In the integration debugger, you can perform many of the available debugging actions by using keyboard shortcuts.