IBM BPM, V8.0.1, All platforms > Authoring services in Integration Designer > Troubleshooting > Use the integration debugger for problem determination > Integration debugger
Breakpoints view in the integration debugger
The Breakpoints view displays the breakpoints that are set on component elements and source code in all components. In the Breakpoints view, you can remove, disable, or enable breakpoints. If you are working with business processes, you can also apply hit counts to breakpoints and restrict breakpoints to specific process threads.
The Breakpoints view is shown in the following figure:
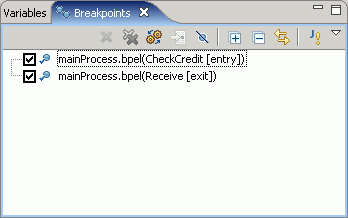
In the Breakpoints view, each breakpoint is identified by one of several symbols (which are also used in the component editors). These symbols are described in the following table:
| Symbol | Description |
|---|---|

| The breakpoint is installed and enabled |

| The breakpoint is installed and disabled |

| The breakpoint is enabled but restricted to one or more threads of the business process |

| The breakpoint is enabled in a line of source code in the Java™ snippet editor or the condition editor |
| The breakpoint is enabled in all threads of the component |

| The breakpoint is disabled |
If you double-click a breakpoint in the Breakpoints view, the component editor that contains the breakpoint is opened.
If you are debugging a business process, you can select a breakpoint in the Breakpoints view and then open the breakpoint Properties window to enable or disable the breakpoint, apply hit counts to the breakpoint, or restrict the breakpoint to specific process threads.