IBM BPM, V8.0.1, All platforms > Programming IBM BPM > Enterprise Service Bus programming > Testing and Debugging
Debugging mediation flows
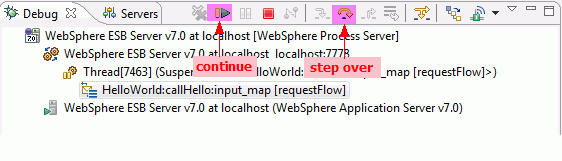
The integration debugger allows you to debug your mediation flow component using a graphical user interface. You can control the flow execution by using breakpoints to step over the running of mediation primitives. When the server is running in debug mode, and a breakpoint is encountered, the running stops. When a component thread pauses at a breakpoint, you can control program flow or alter the state of the running component. You can use the variables view to inspect the data or message.
To debug a mediation flow...
- Start the server in debug mode by selecting Debug from the server's context menu.
- Add the projects that you want to debug to the server.
- Open the mediation flow that you want to debug.
- Select a mediation primitive that you want the flow execution to pause at, right-click and select Debug -> Add Breakpoint.
- If you want to debug within a subflow, you must open the subflow and set a breakpoint on a mediation primitive in the subflow.
- Open the assembly diagram and launch the integration test client to test the mediation flow component.
- Enter the test data in value editor of the integration test client.
- Click Continue to start running the test.
- The flow execution will pause at the first breakpoint. You can inspect the message coming in to the mediation primitive in the Variables view.
- When you have inspected the message, you can then step over the primitive or continue the flow execution until it hits the next breakpoint.