6.4.2 The Tivoli Performance Viewer
Overview
You can enable the performance monitoring infrastructure of WebSphere Application Server to collect metrics relevant to WebSphere eXtreme Scale. These metrics provide information about response times and the cache. The Tivoli Performance Viewer, available in the WebSphere administrative console, can be used to view these metrics.
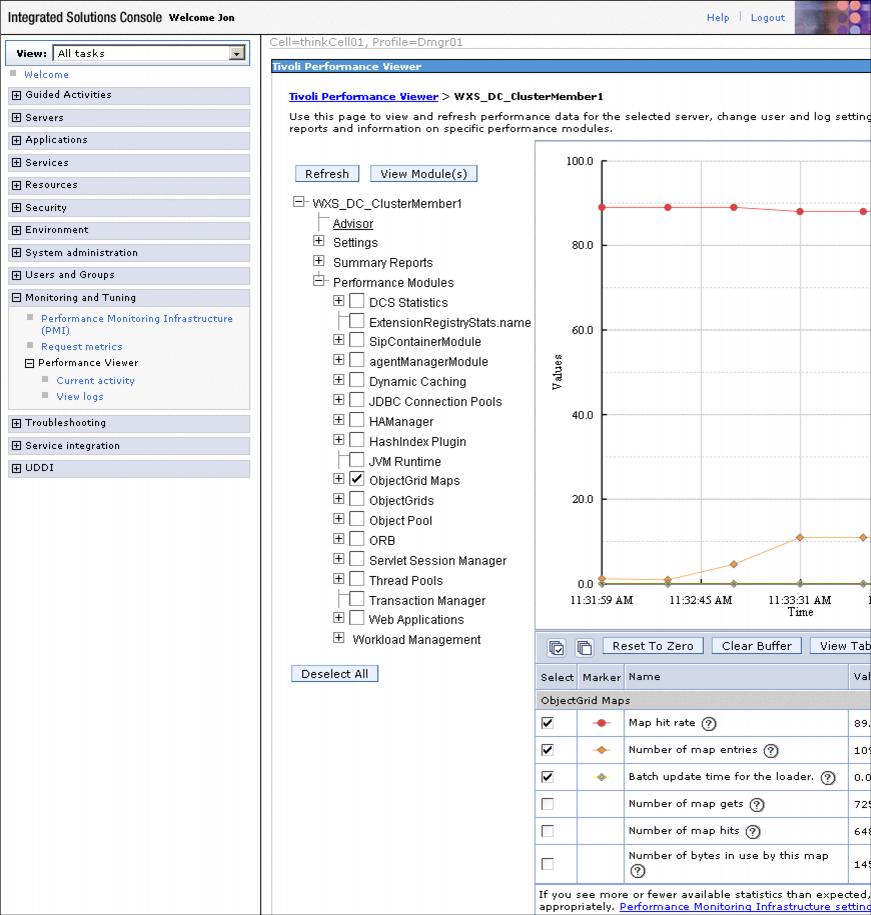
Figure 6-21 shows an example of the metrics for the ObjectGrid maps collected for one of the servers in the eXtreme Scale cluster.

The primary benefit of using the Performance Viewer is when you need to analyze the performance and behavior of an application server. You can review the eXtreme Scale statistics in the context of the other application server metrics.
Information on setting up the Tivoli Performance Viewer for use with eXtreme Scale can be found in 3.8.3, Monitoring with the Tivoli Performance Viewer. More information can be found in the Information Center.
Error 404 - Not Found
The document you are looking for may have been removed or re-named. Please contact the web site owner for further assistance.