Overview of the WLDF Architecture
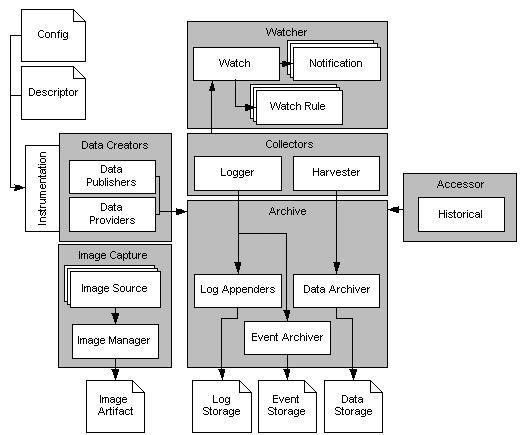
The WebLogic Diagnostic Framework (WLDF) consists of a number of components that work together to collect, archive, and access diagnostic information about a WebLogic Server instance and the applications it hosts.
Concepts are presented in this section in a way to help you understand how WLDF works. Some of this differs from the way WLDF is surfaced in its configuration and runtime APIs and in the WebLogic Server Console. If you want to start configuring and using WLDF right away, you can safely skip this discussion and start with Understanding WLDF Configuration.
- Overview of the WebLogic Diagnostic Framework
- Data Creation, Collection, and Instrumentation
- Archive
- Watch and Notification
- Data Accessor
- Diagnostic Image Capture
- How It All Fits Together
Overview of the WebLogic Diagnostic Framework
WLDF consists of the following:
- Data creators (data publishers and data providers that are distributed across WLDF components)
- Data collectors (the Logger and the Harvester components)
- Archive component
- Accessor component
- Instrumentation component
- Watch and Notification component
- Image Capture component
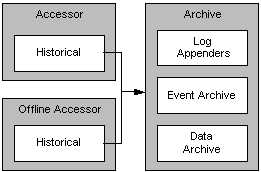
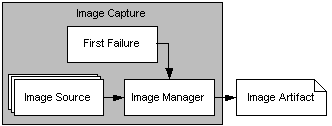
Data creators generate diagnostic data that is consumed by the Logger and the Harvester. Those components coordinate with the Archive to persist the data, and they coordinate with the Watch and Notification subsystem to provide automated monitoring. The Accessor interacts with the Logger and the Harvester to expose current diagnostic data and with the Archive to present historical data. The Image Capture facility provides the means for capturing a diagnostic snapshot of a key server state.
All of the framework components operate at the server level and are only aware of server scope. All the components exist entirely within the server process and participate in the standard server lifecycle. All artifacts of the framework are configured and stored on a per server basis.
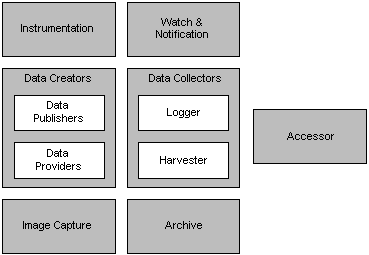
Data Creation, Collection, and Instrumentation
Diagnostic data is collected from a number of sources. These sources can be logically classified as either data providers, data creators that are sampled at regular intervals to harvest current values, or data publishers, data creators that synchronously generate events. Data providers and data publishers are distributed across components, and the generated data can be collected by the Logger and/or by the Harvester
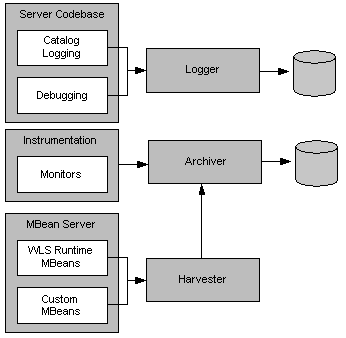
Invocations of the server logging infrastructure serve as inline data publishers, and the generated data is collected as events. (The logging infrastructure can be invoked through the catalog infrastructure, the debugging model, or directly through the Logger.)
The Instrumentation system creates monitors and inserts them at well-defined points in the flow of execution. These monitors publish data directly to the Archive.
Components registered with the MBean Server may also make themselves known as data providers by registering with the Harvester. Collected data is then exposed to both the Watch and Notification system for automated monitoring and to the Archive for persistence.
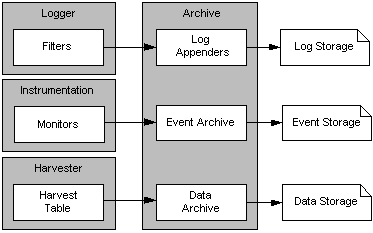
Archive
The past state is often critical in diagnosing faults in a system. This requires that the state be captured and archived for future access, creating a historical archive. In WLDF, the Archive meets this need with several persistence components. Both events and harvested metrics can be persisted and made available for historical review.
Traditional logging information, which is human readable and intended for inclusion in the server log, is persisted through the standard logging appenders. New event data that is intended for system consumption is persisted into an event store using an event archiver. Metric data is persisted into a data store using a data archiver. The relationship of the Archive to the Logger and the Harvester.
The Archive provides access interfaces so that the Accessor may expose any of the persisted historical data.
Watch and Notification
The Watch and Notification system can be used to create automated monitors that observe specific diagnostic states and send notifications based on configured rules.
A watch rule can monitor log data, event data from the Instrumentation component, or metric data from a data provider that is harvested by the Harvester. The Watch Manager is capable of managing watches that are composed of a number of watch rules.
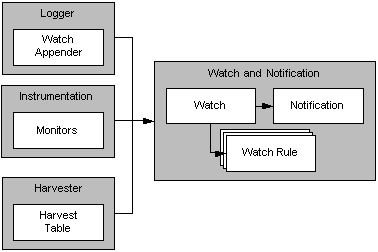
One or more notifications can be configured for use by a watch. By default, every watch logs an event in the server log. SMTP, SNMP, JMX, and JMS notifications are also supported.
Data Accessor
The Accessor provides access to all the data collected by WLDF, including log, event, and metric data. The Accessor interacts with the Archive to get historical data including logged event data and persisted metrics.
When accessing data in a running server, a JMX-based access service is used. The Accessor provides for data lookup by type, by component, and by attribute. It permits time-based filtering and, in the case of events, filtering by severity, source and content.
Tools may need to access data that was persisted by a currently inactive server. In this case, an offline Accessor is also provided. You can use it to export archived data to an XML file for later access. To use the Accessor in this way, use the WebLogic Scripting Tool (WLST) and must have physical access to the machine.
Diagnostic Image Capture
Diagnostic Image Capture support gathers the most common sources of the key server state used in diagnosing problems. It packages that state into a single artifact which can be made available to support technicians. The diagnostic image is in essence a diagnostic snapshot or dump from the server, analogous to a UNIX “core” dump.
How It All Fits Together